What if you found a simple yet effective way to trace HTTP(s) requests and responses with a few clicks? While you may initially miss the painstaking method of tracing HTTP requests manually, you can harness the power of a web proxy to trace and debug network requests and responses.
Could you put it in perspective? You have hundreds of requests coming from your system, whether it be a web browser, an application, or any process running in the background of your network. It's 4:40 pm, and your boss notifiies you that there is site failure and expects you to trace and debug an application immediately. With no time to spare, you need to turn to a tool that can securely perform an HTTP trace. You turn to Fiddler Everywhere; it is easy to download, install, and comes with a free 30-day trial and works on Windows, macOS and Linux. Within 10 minutes, you are using Fiddler Everywhere's traffic inspector to trace every HTTP network request. By tracing all HTTP requests within Fiddler Everywhere's live traffic tab, you look for failing requests, incorrect responses, and performance concerns to troubleshoot the problem.Steps to Take:
- Download Fiddler Everywhere from https://www.telerik.com/download/fiddler-everywhere and select the appropriate install, Windows, macOS or Linux.
- Start the tool, then the browser or client app. Reproduce the problem.
- Fix the problem, Menu > Tools > Options > HTTPS tab > Check Decrypt HTTPS traffic.
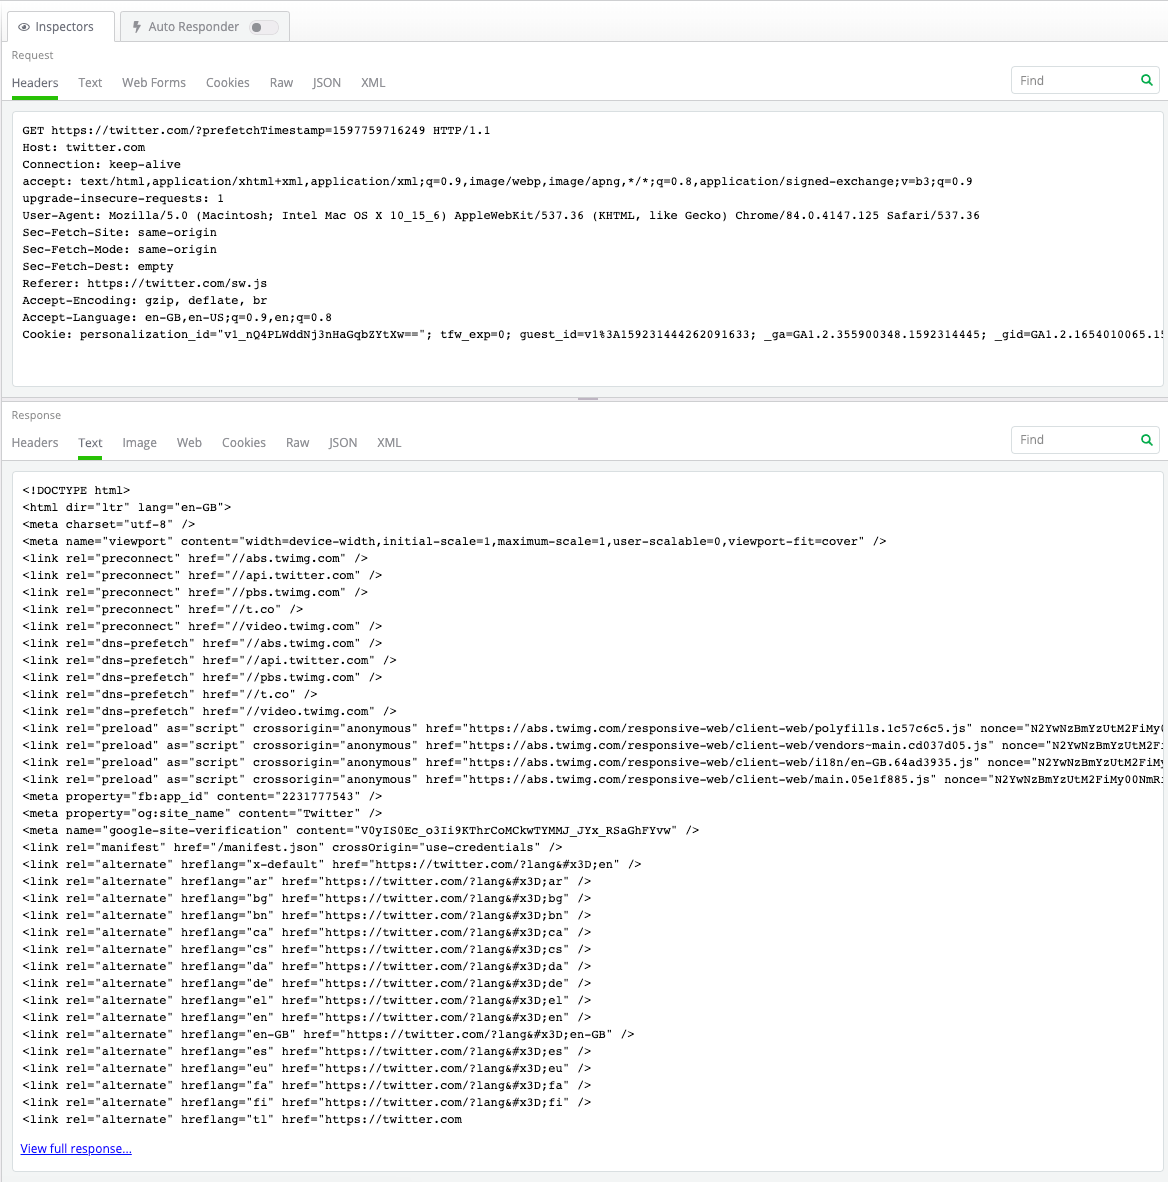
Fiddler Everywhere has different types of Traffic Inspectors available, which can be used based on the content's format. You can switch the Inspectors by merely clicking on the required tab. Some of the available Inspectors in Fiddler Everywhere include:
- Headers
- Text
- Raw
- JSON
- XML
- Cookies
- Web Forms (Request only)
- Image (Response only)
- Web (Response only)

What You Can Accomplish by Tracing HTTP Requests On-the-Fly
Quick insight into network traffic requests
For example, you can trace the type of content that has been received, whether it's an HTML format, JSON, or if it's a CSS or JavaScript.
Look at requests side by side
You can trace HTTP(S) status codes and the protocol and the host, and the URL of the network request. Plus, Fiddler Everywhere provides insight about the method and the body size, along with the content type and the process from which the request originated.
Ability to go deeper within a request
If you want to further trace a particular request, all you need to do is click on that request, and you will see the request inspector at the top and the response inspector at the bottom.
The on-the-fly process described above gives you an advantage you won't experience outside of Fiddler Everywhere: the ability to play with the traffic and trace non-web apps. You can't solve an issue if you can't see it and that is what Fiddler Everywhere HTTP tracing does; it lets you go behind the scenes to get to a fix right away.
There are other scenarios where the use of HTTP tracing can help you debug issues. Whether you need to trace different devices or manipulate responses to run "what if's" or intercept your traffic, you can use Fiddler Everywhere to speed up your debugging process and go from error to fix faster than you ever thought possible. Don't leave your HTTP(s) tracing and debugging success to chance—start a 30-day trial to realize the benefits you can derive from adding Fiddler Everywhere to your workflow.
Get started with the steps above today to trace your HTTP requests, there is no software to ship, or lengthy approval process—the software is ready to go at https://www.telerik.com/fiddler.