An introduction to Vue Devtools: Your master guide to debugging Vue apps. Learn how to use them through a sample app.
Devtools is a set of utility tools that help a developer in developing applications. For web developers, we have Chrome DevTools (which you can learn more about here). For Vue developers, we have Vue Devtools, which helps you debug your application. I'll show you how to use Vue Devtools by inspecting a sample application.
Set up Devtools & Sample Project
Let's get started by installing it in our browser. I'll be using Chrome but it also works in Firefox. The version used for this guide is 4.1.5 beta. Follow one of the links below to add it to Chrome or Firefox:
Once downloaded, it is ready to be used.
We'll be working with a sample Vue application, which you can find on GitHub. Follow the instructions on that page to download and get it working locally. Start the application by running `npm start` and navigating to http://localhost:8080/. Open Chrome DevTools and you should find a tab for Vue.
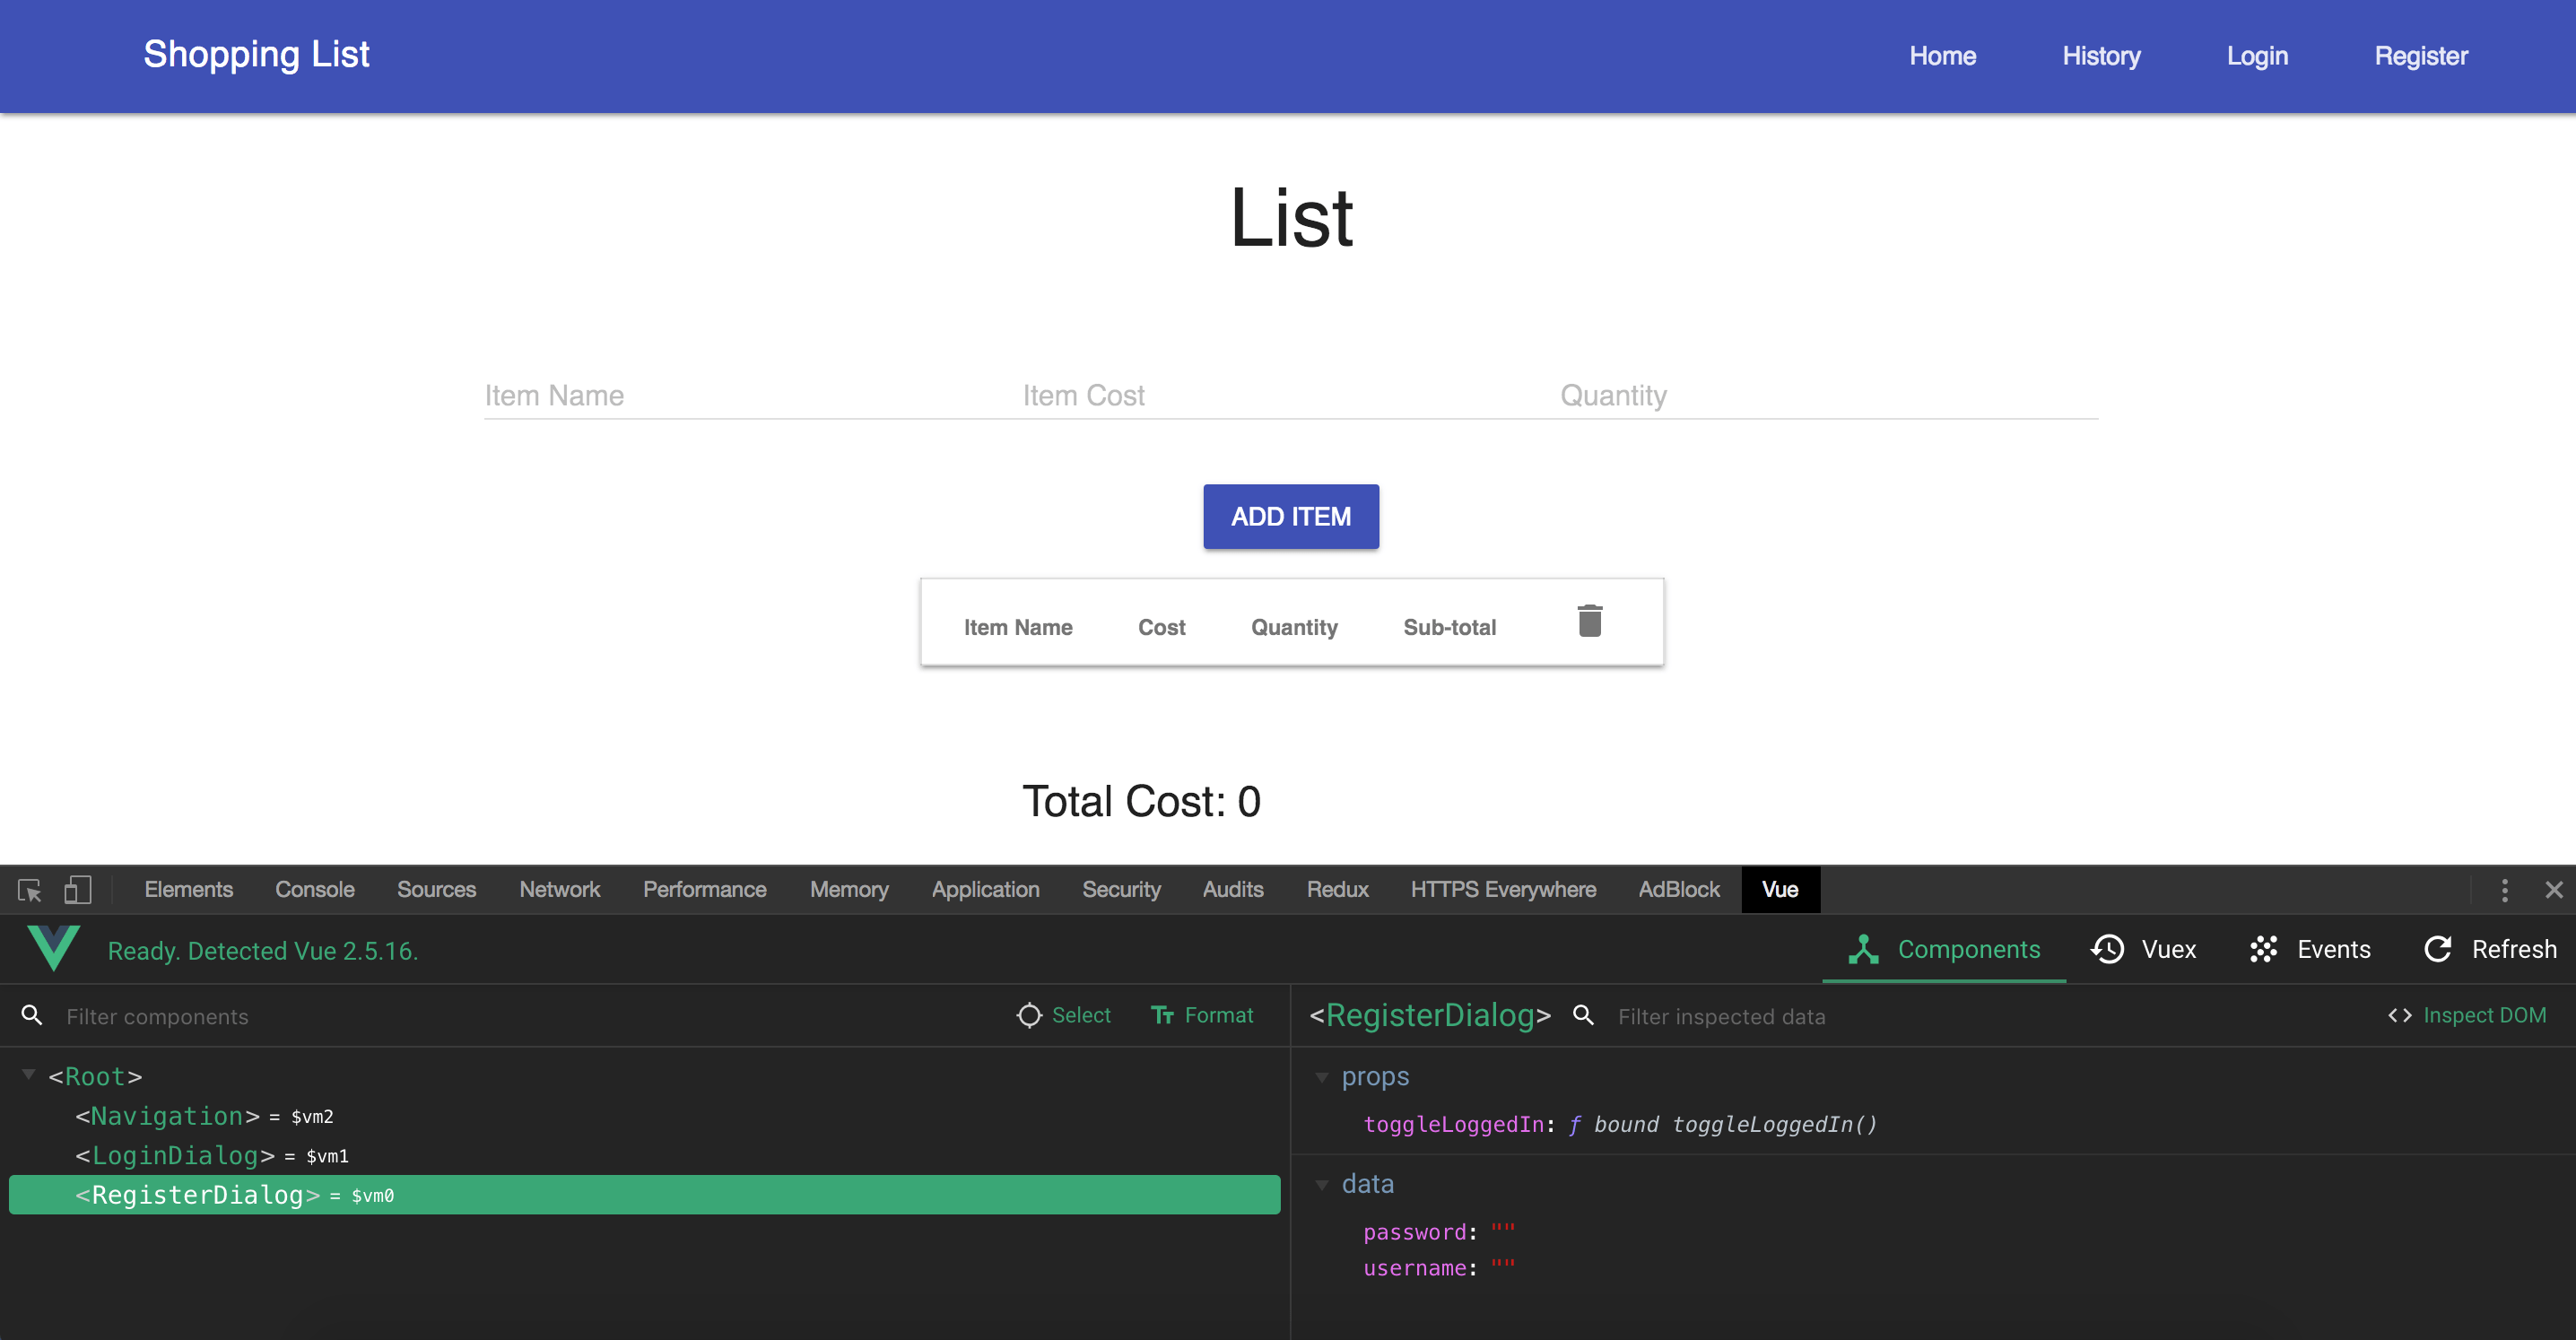
In Vue Devtools, you have to be using the development build of Vue.js for the inspection to work. The sample app is using a development build, that's why we're able to inspect it.
What Can I do with It?
Vue Devtools can be used to inspect your components, events, and state. Each of these has its own tab, and we'll take a look at what we can do for each.
Components Tab
The Components tab shows the components used on a page, along with the `data` properties and `prop` values. On the left side, you find the components listed according to their hierarchy on the page. The component name is shown in PascalCase by default. You can toggle it to show the original component name by clicking the **Format** button at the top. Selecting one of them should show information such as the `data,` `props` and `computed` properties for that component.
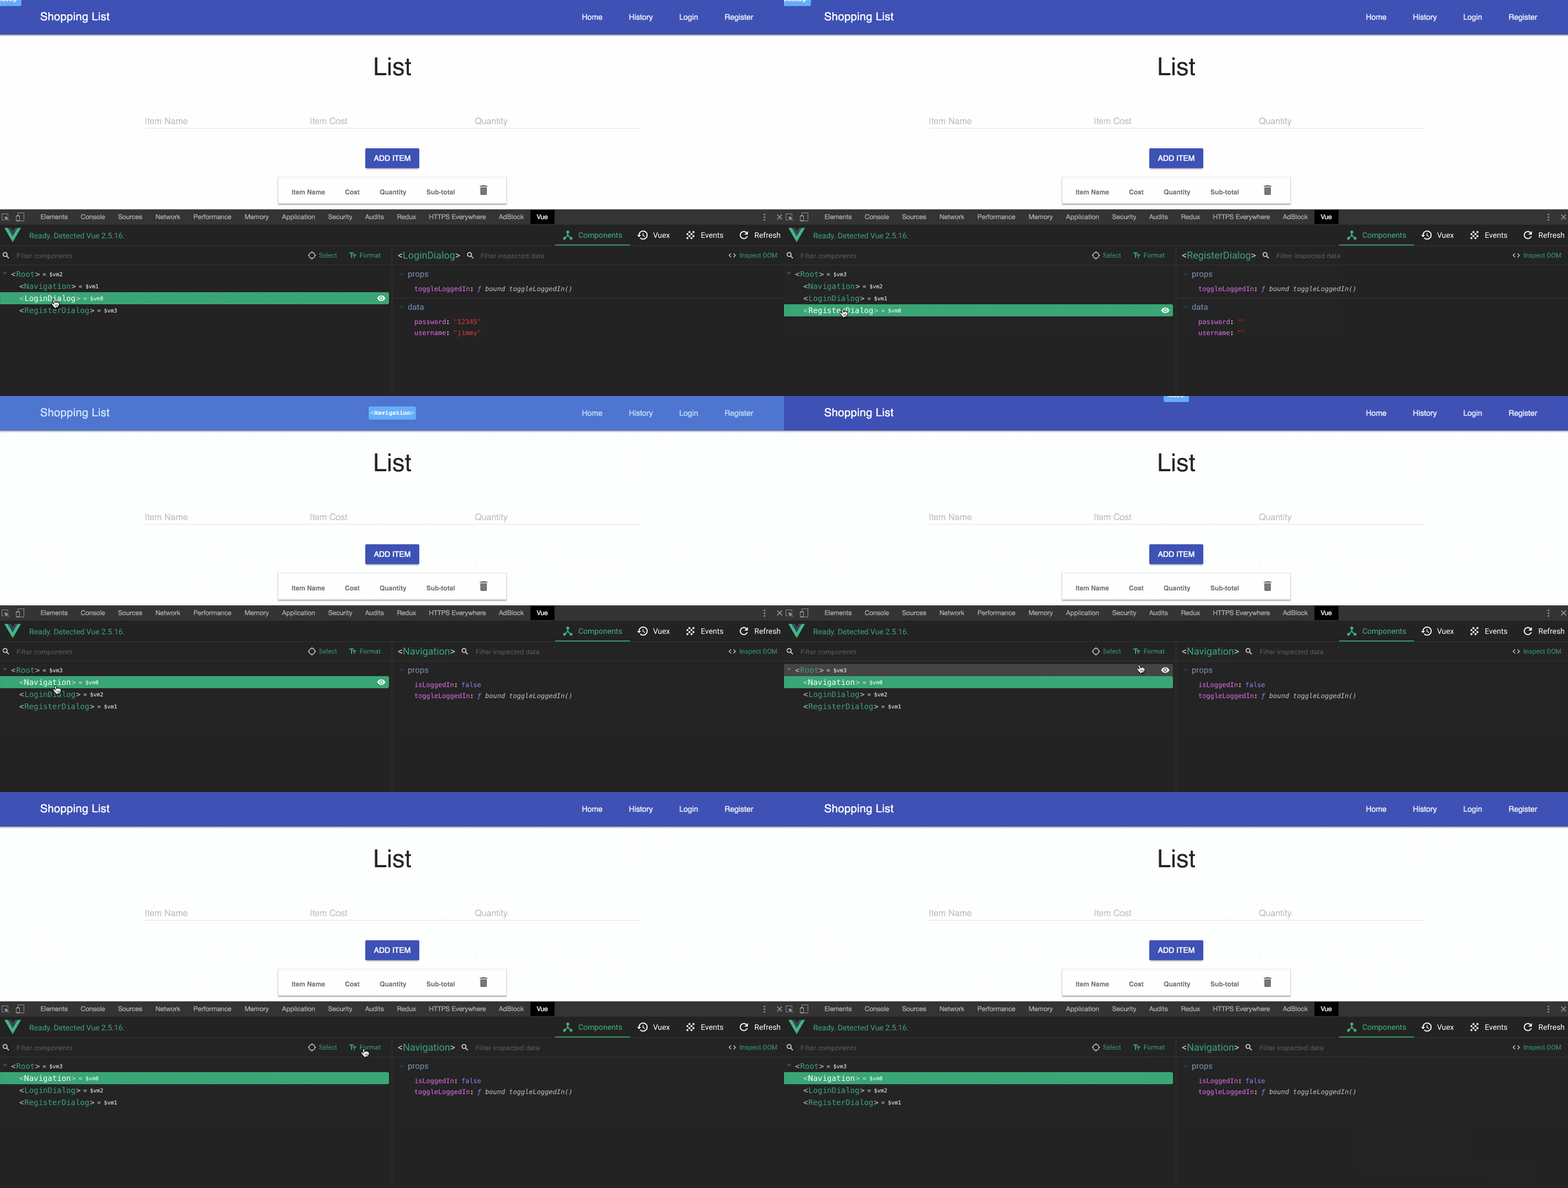
On the right, you see the `data` properties for a component. When the component receives input and those values change, you can see them reflected there. You can also edit those values and see them reflected on the page.
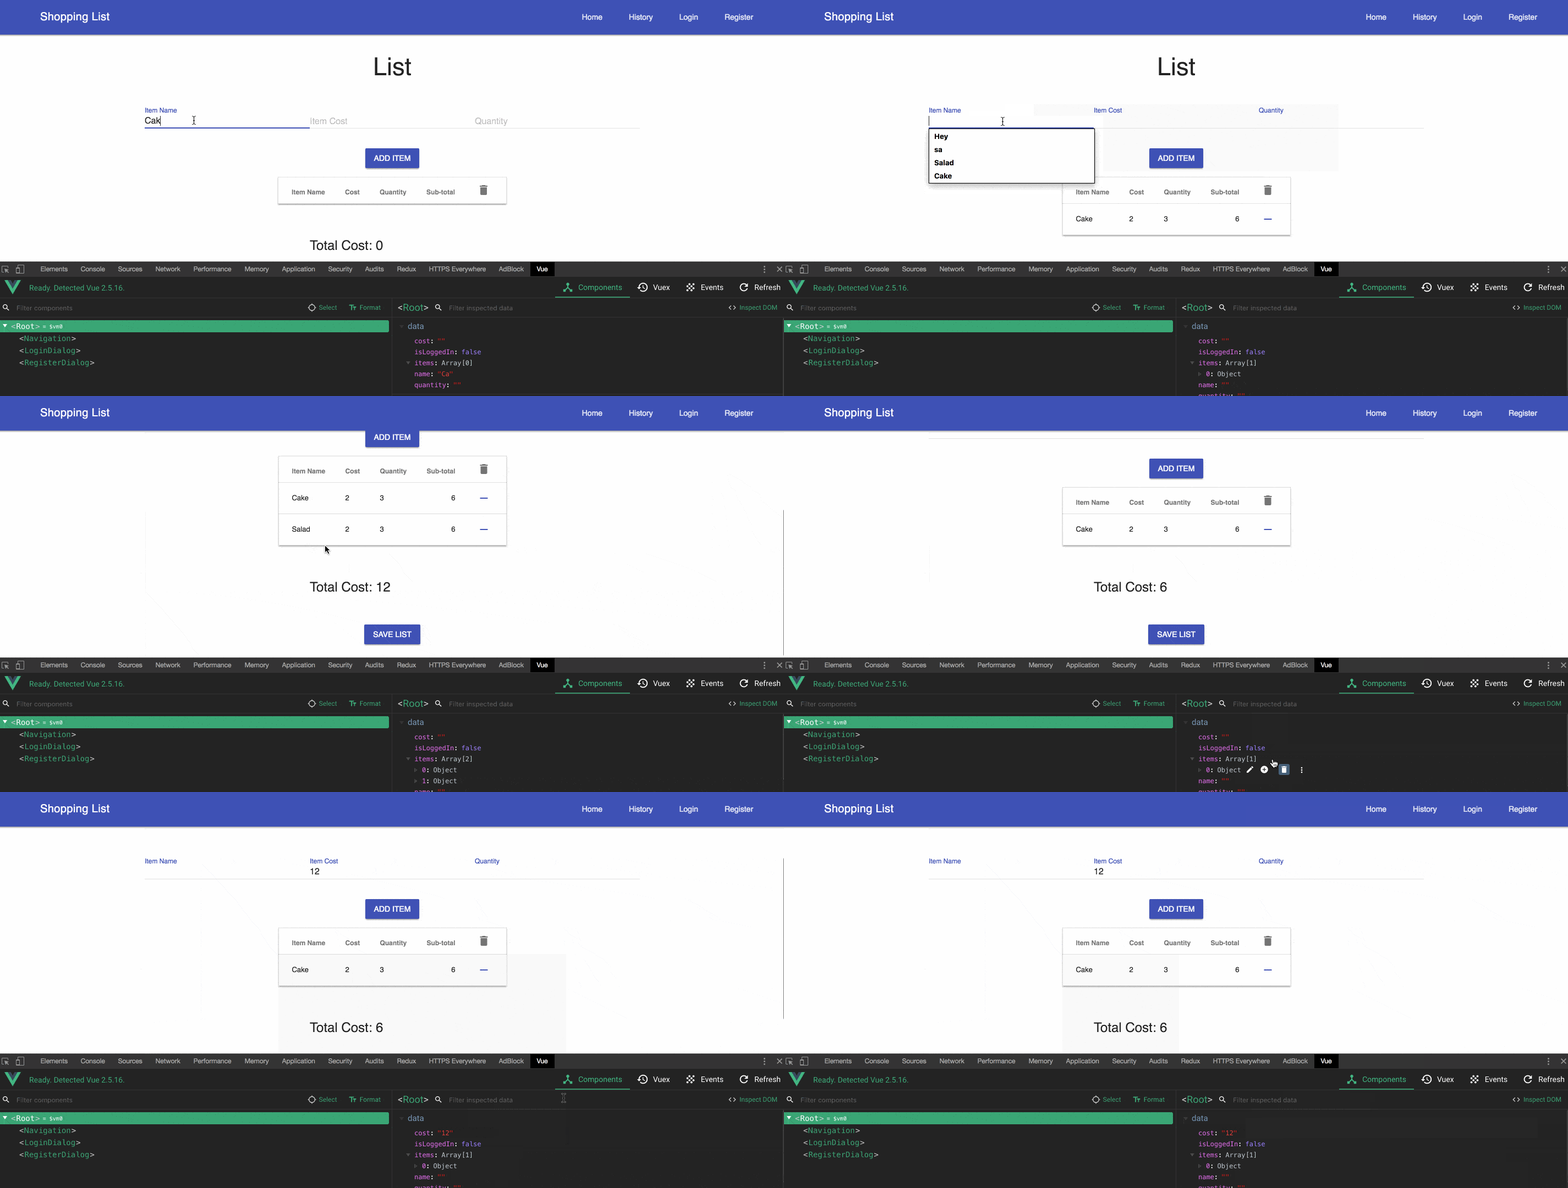
You can also filter to find a component or one of its properties on the right side. Also on the right side, you find the **Inspect DOM** button, which, when clicked, will take you to where that component is rendered in the DOM, shown in the Elements tab.
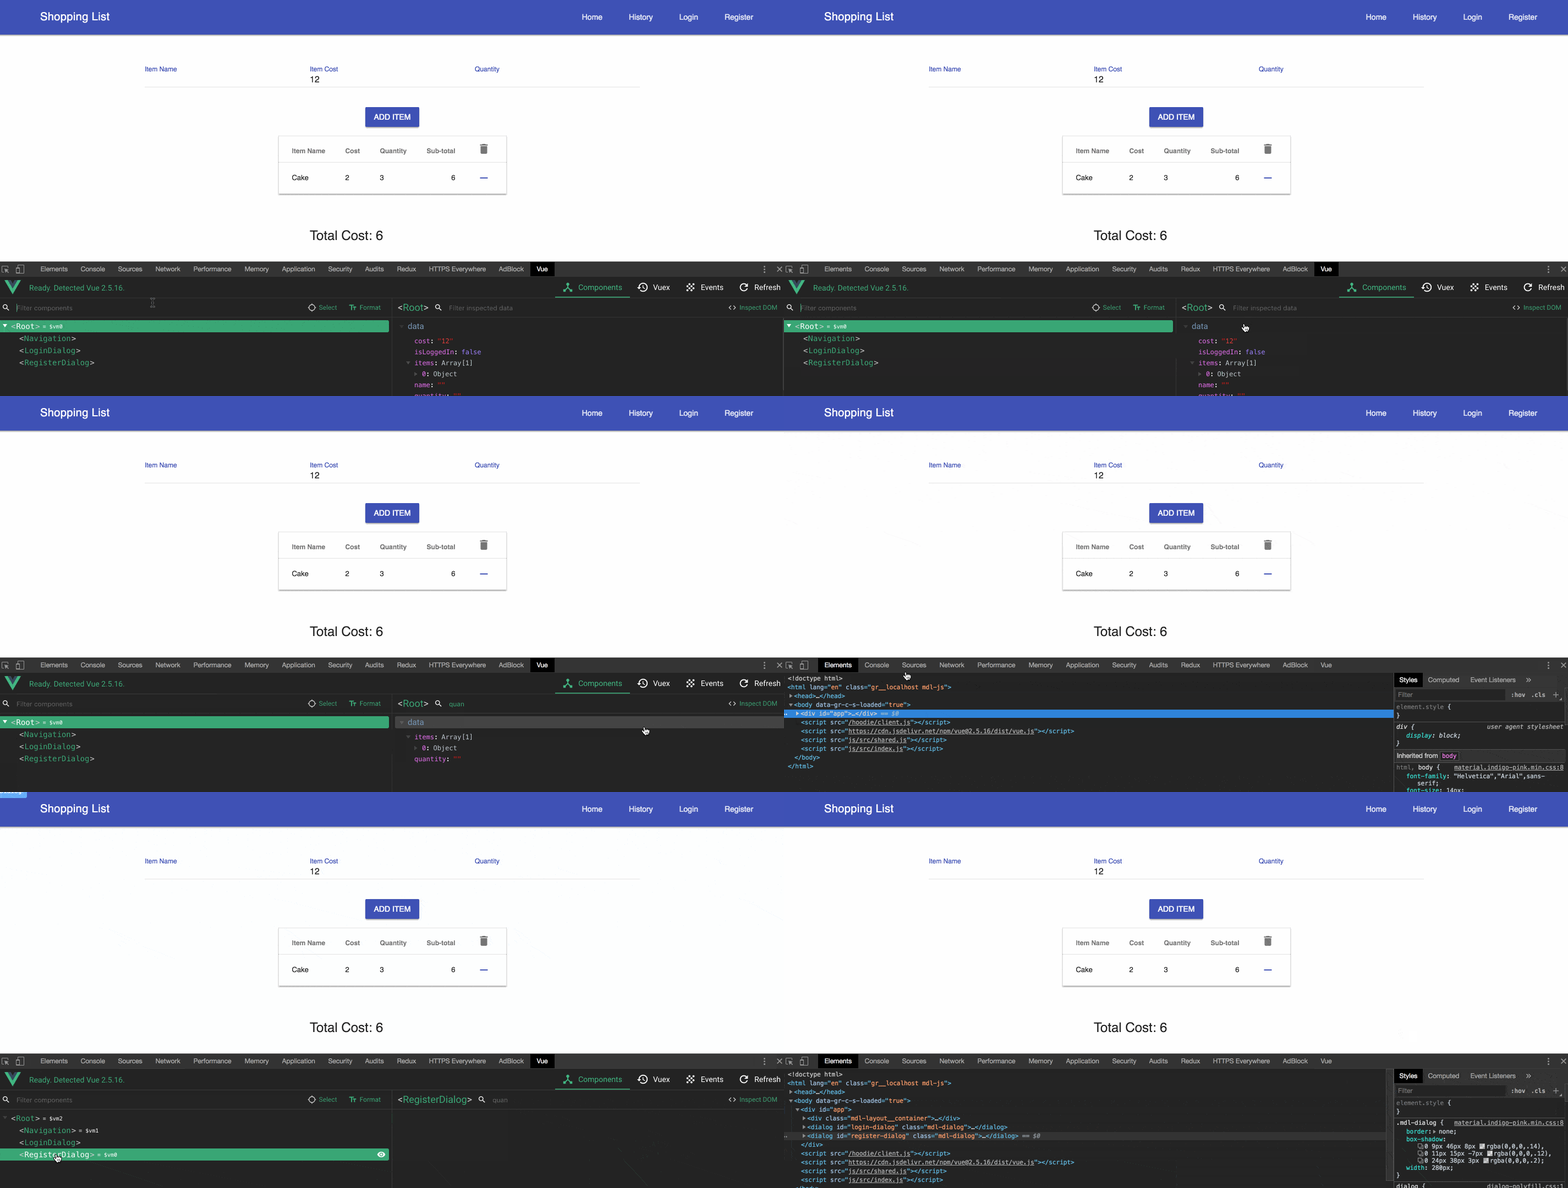
Events Tab
The Events tab shows the events captured on the left side. Selecting an event displays the event info on the right side. You can filter the events and also pause it to stop capturing events by clicking the **Recording** button - a toggle button to switch between capturing and not capturing events in your application. The sample application doesn't use any event, so you won't find anything on this tab. Here's a video that should give you a sense of how it works.
Vuex Tab
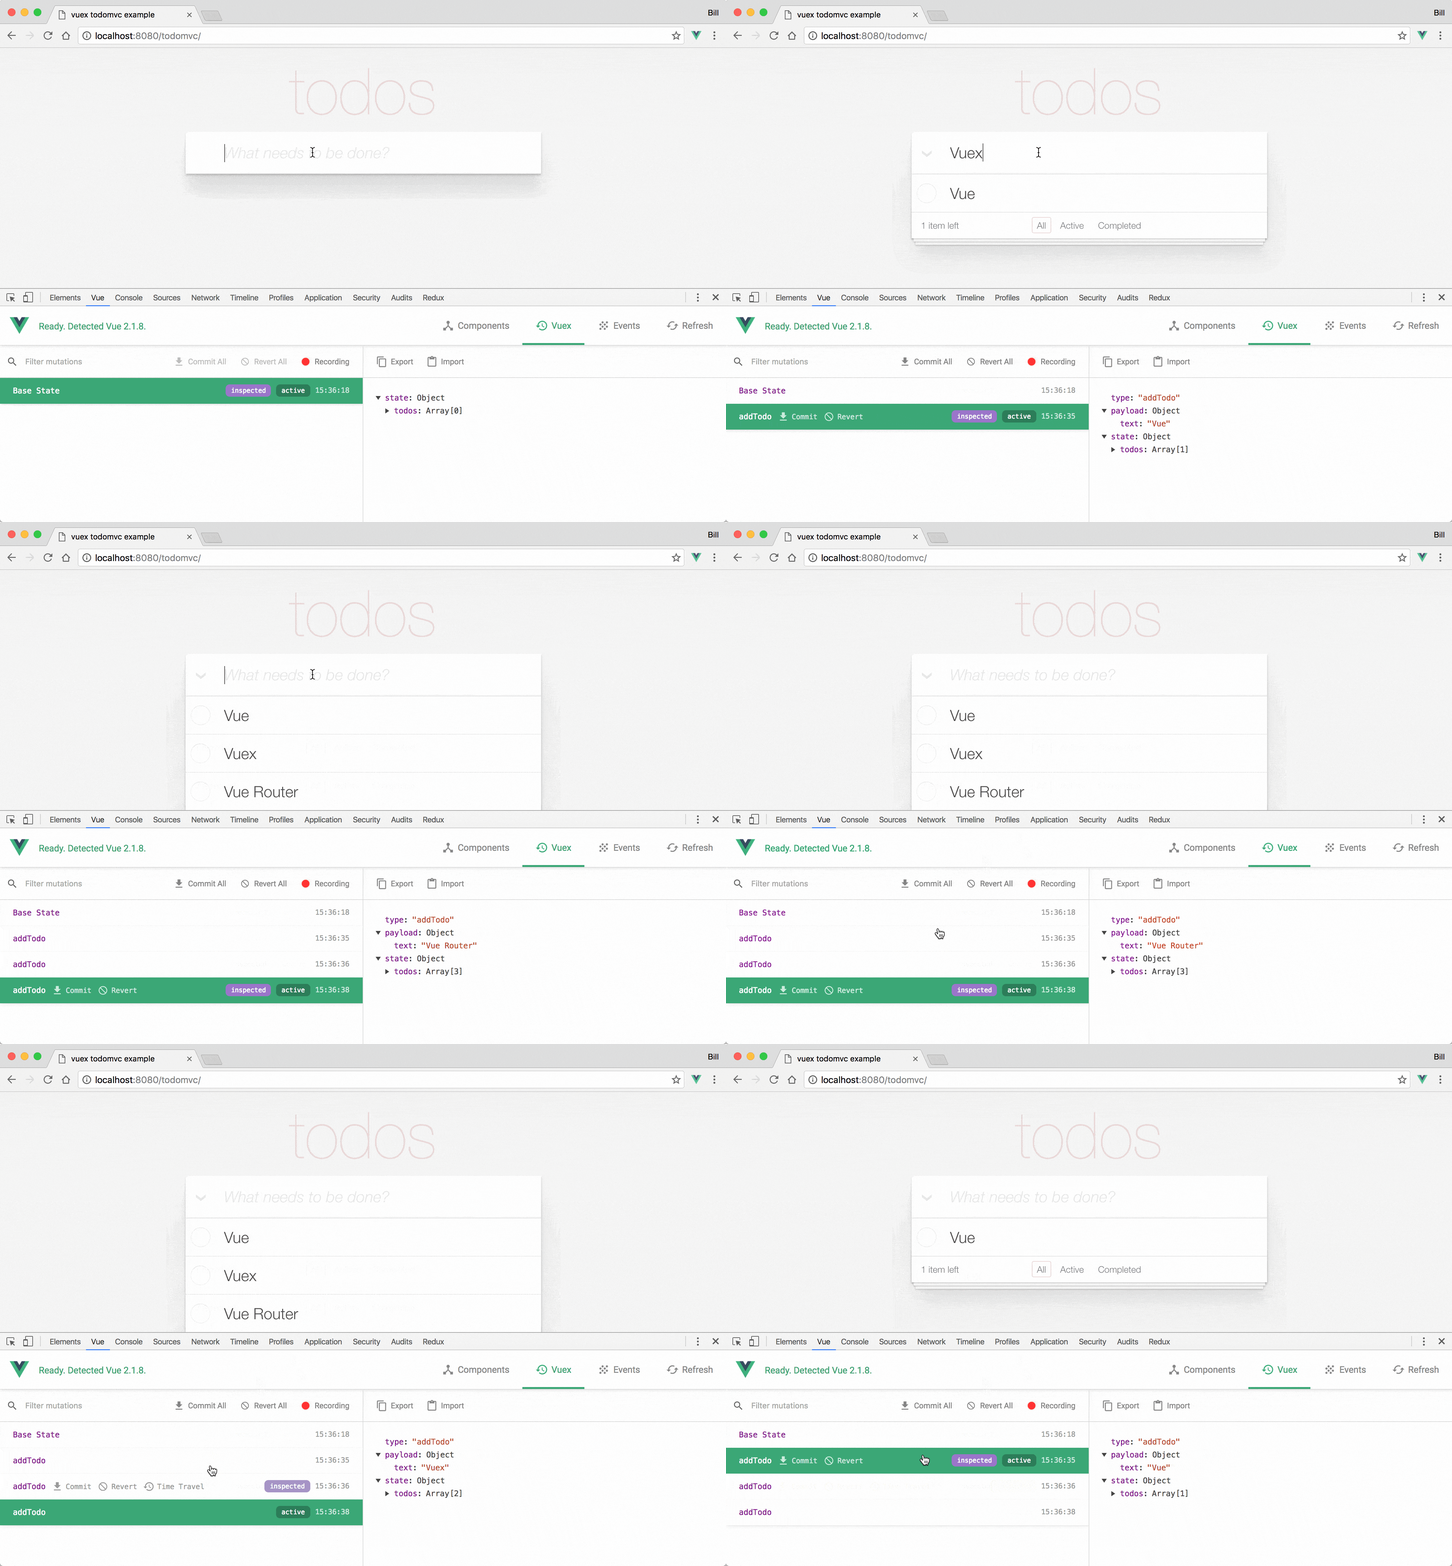
The Vuex tab is used for inspecting Vuex mutations. On the left side, it lists the mutations that have happened, and you can filter them. Selecting one will display the information on the right side with information about that mutation. When one is selected, you'll see an option **Time Travel,** which will revert the state to when that action happened. This is useful for time travel debugging. The sample app you downloaded doesn't use Vuex, so you will see an empty tab. Below is an image of it working for a different application
That's A Wrap
We've looked at the three tabs available in Vue Devtools. From time travel debugging for Vuex to component inspection on the **Components** tab, using this tool becomes valuable and makes developing Vue.js applications a breeze. I showed how to use this in the browser, but you can also get the standalone electron app right here.
For more Vue info: Want to learn about creating great user interfaces with Vue? Check out Kendo UI for Vue with everything from grids and charts to schedulers and pickers.