Debugging client-side JavaScript can be a frustrating experience. The environment in which your code is running means a large number of things could go wrong—browser feature compatibility, dependency issues, resources failing to download, just to name a few.
In this article, I have outlined a few tips on client-side debugging that you may not know about and could be a game changer in your developer career!
Contents
- DevTools
- IntelliSense
- Testing JavaScript Code Real-Time
- View Logs
- Working with Elements
- Working with Telerik RadGrid
- Debugger
Browsers’ Developer Tools
The browsers’ Developer Tools provide various information the developers can use to analyze and troubleshoot web applications. That includes inspecting the rendered HTML; viewing informational or error logs; and examining network-related information such as types of connections and their status, loaded resources and more. Today most browsers have the DevTools embedded.
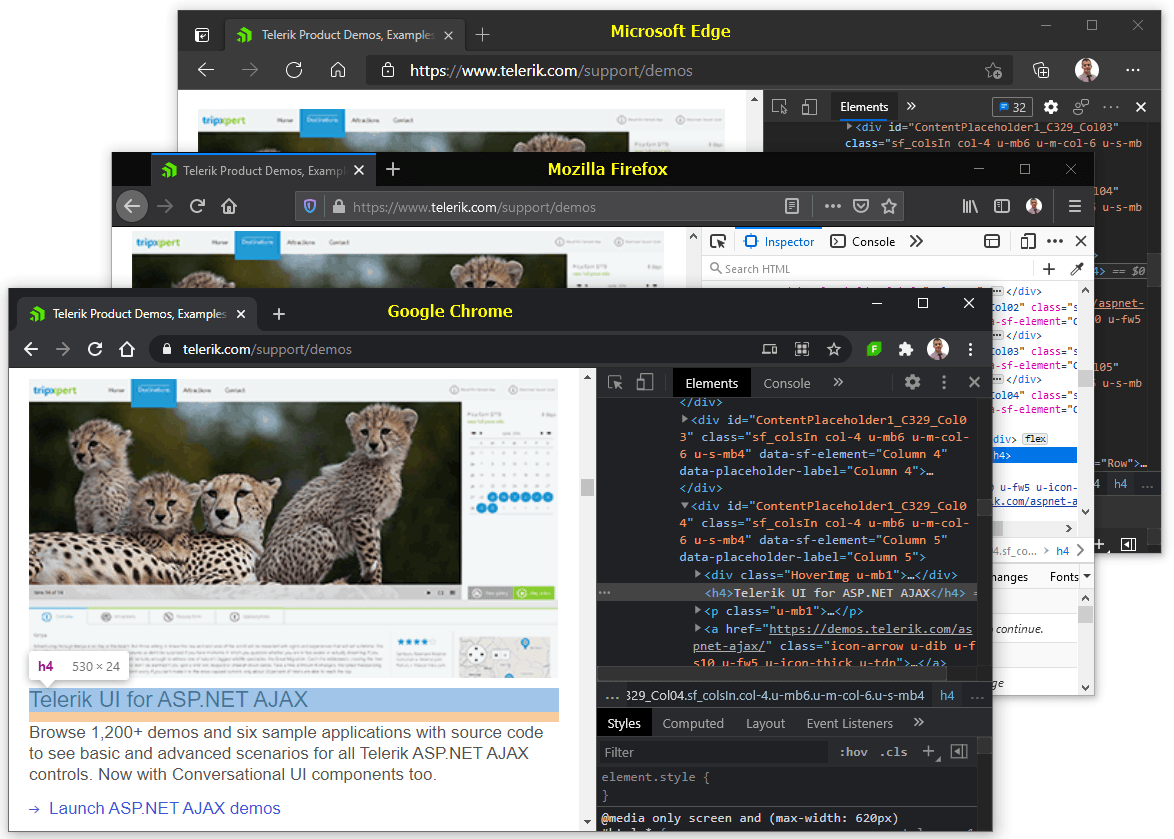
Depending on the information you would like to review, the DevTools have them grouped in different tabs:
- The Elements inspector, where you can inspect the rendered HTML elements and styles applied
- The Console tab that acts as a Command Line Interface used to display errors, warnings and other informational logs; it can also be used to interact with JavaScript and see the results in real-time
- The Network tab that shows information about connections, their types and status, and resources that are loaded on the page; this tool is mostly used to determine the resources loaded, requests sent or responses received, and HTTP status
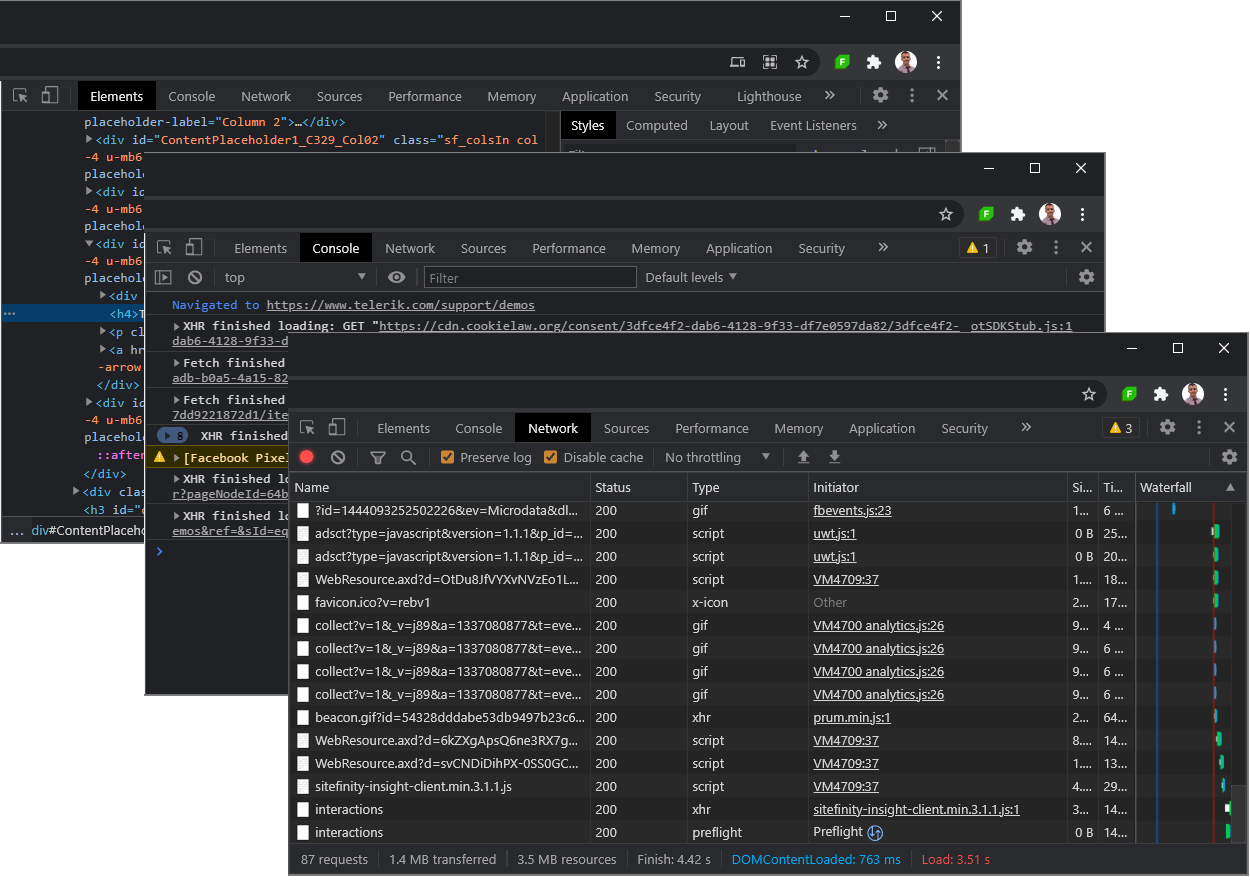
The DevTools contain many more tools you could use to troubleshoot your website and monitor its performance/health. However, in this article I will mainly focus on the Console and teach you some tricks to debug applications on client-side.
IntelliSense
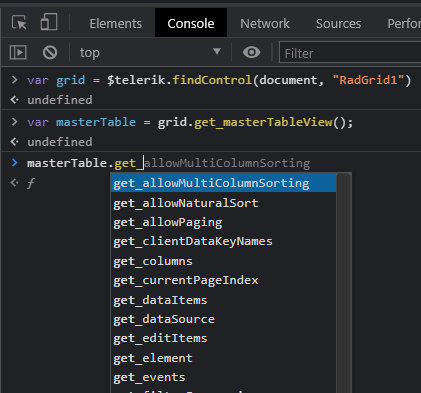
One of the many benefits of an IDE application is the IntelliSense (code completion) functionality that we depend on every day. It helps us avoid making mistakes in typing/character casing of variables or functions. The best part of it is that we can see methods/properties available in a certain class or object.
Today, the browsers’ DevTools can make this happen. How cool is that?
Testing JavaScript Code
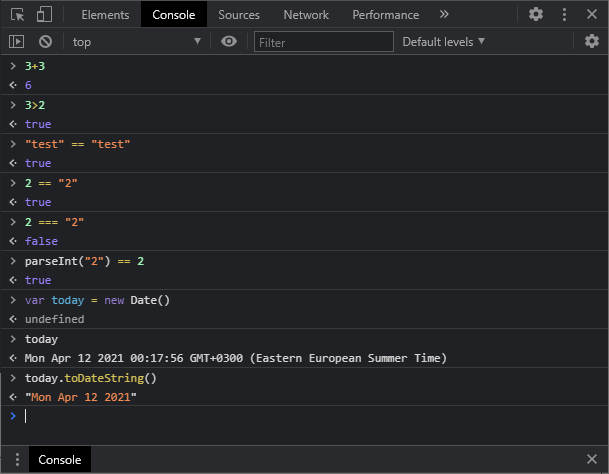
Other than code completion, the DevTools Console can also execute JavaScript code and show the results in real time. You may test your code before adding it to your application.
View Logs
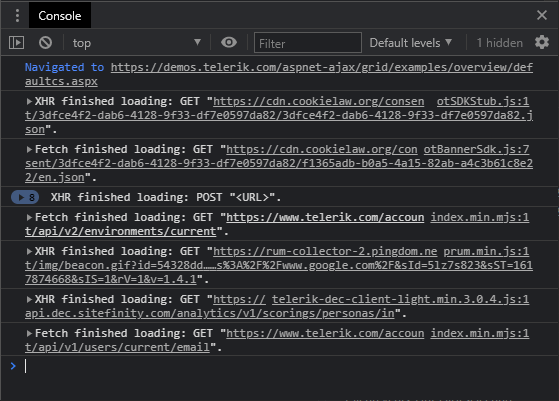
Ever wonder why nothing happens upon interacting with the controls on the Page? Open the DevTools and monitor the Console Tab to find out whether the app is generating an error.
HTTP Requests
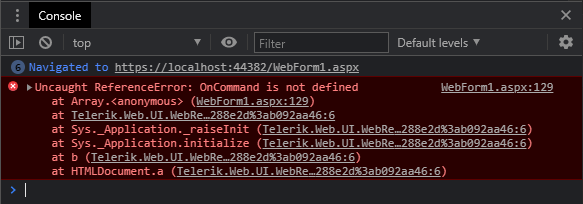
JavaScript Errors
It is a common scenario that applications tend to do nothing when they are expected to. Likely a JavaScript exception stops the execution of all other scripts on the page. By monitoring the Console at all times, this problem can be identified as soon as it appears.
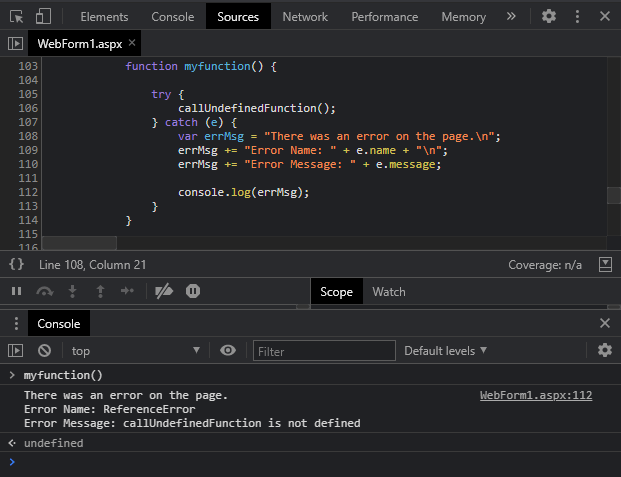
Console Logs
Similarly to .NET Framework’s Debug.WriteLine(), the DevTools Console also has its own function to print information, the console.log() method. It is commonly used to print out variables and results returned by functions, and also handle exceptions silently without crashing the entire application.
Working with Elements
Many developers, including us, are working with elements every day, trying to find ways to manipulate the HTML DOM and bend it to our needs. By using the Console, we can easily determine which of our methods will succeed before even writing the code in the production.
Reference HTML Elements
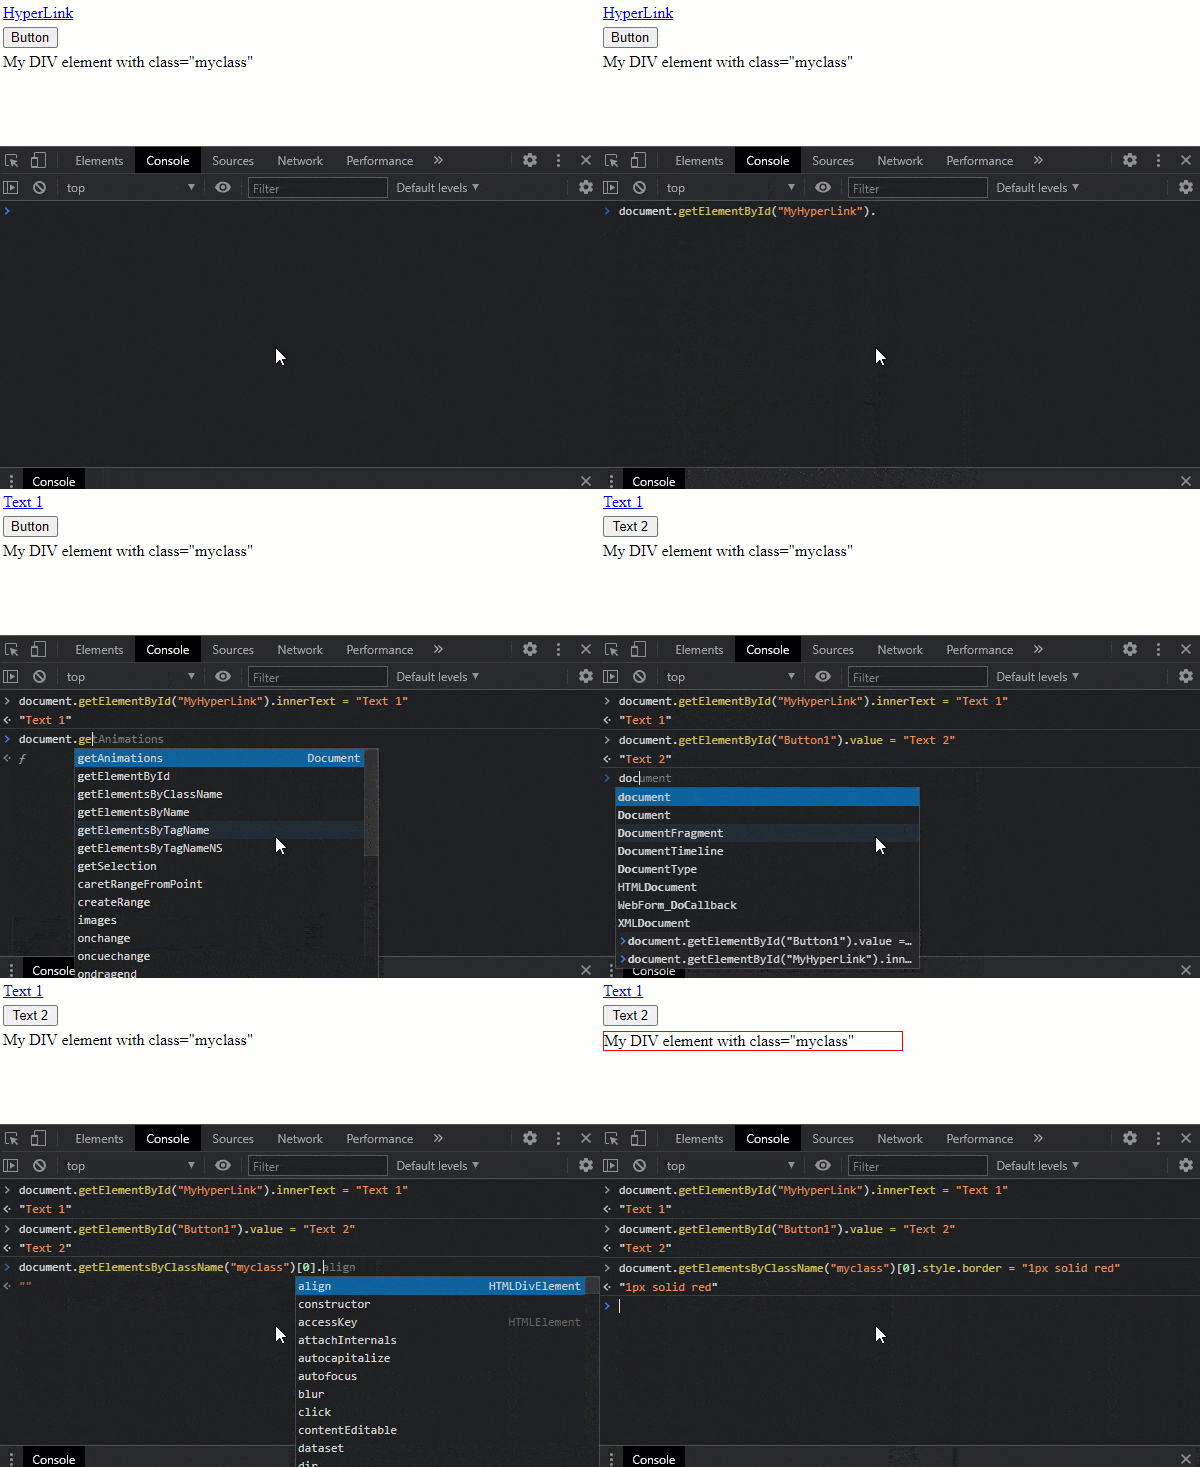
The following example demonstrates referencing HTML elements using pure JavaScript in the Console.
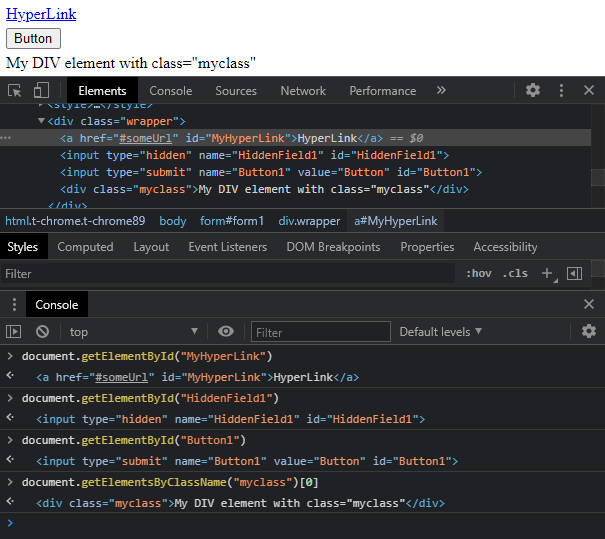
Interacting with HTML Elements
Here&srquo;s an example for visually manipulating HTML elements. Although this is just a temporary change, the code, if proven to be working, can be added to the page and executed each time it is necessary.
Working with RadGrid
Working with Telerik RadGrid isn’t more complicated. With its rich Client-Side APIs, you can have significant control over it.
Get Reference
As Telerik Web Components, the RadGrid and all the other Telerik Components have APIs to help facilitate development. They provide an easy way to gain access to their component and JavaScript objects, and to customize their behavior for your needs.
For more information check out the Get Client-side Reference to a Control Object documentation article.
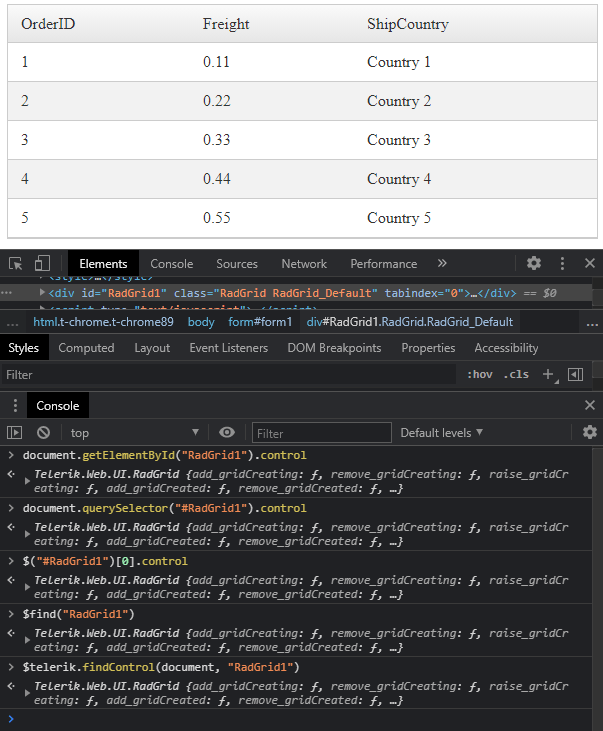
Here is an example of getting a reference to RadGrid using a few common approaches:
Change the PageSize
Once you have reference to the Grid, you can start using the Object properties and methods to manipulate it.
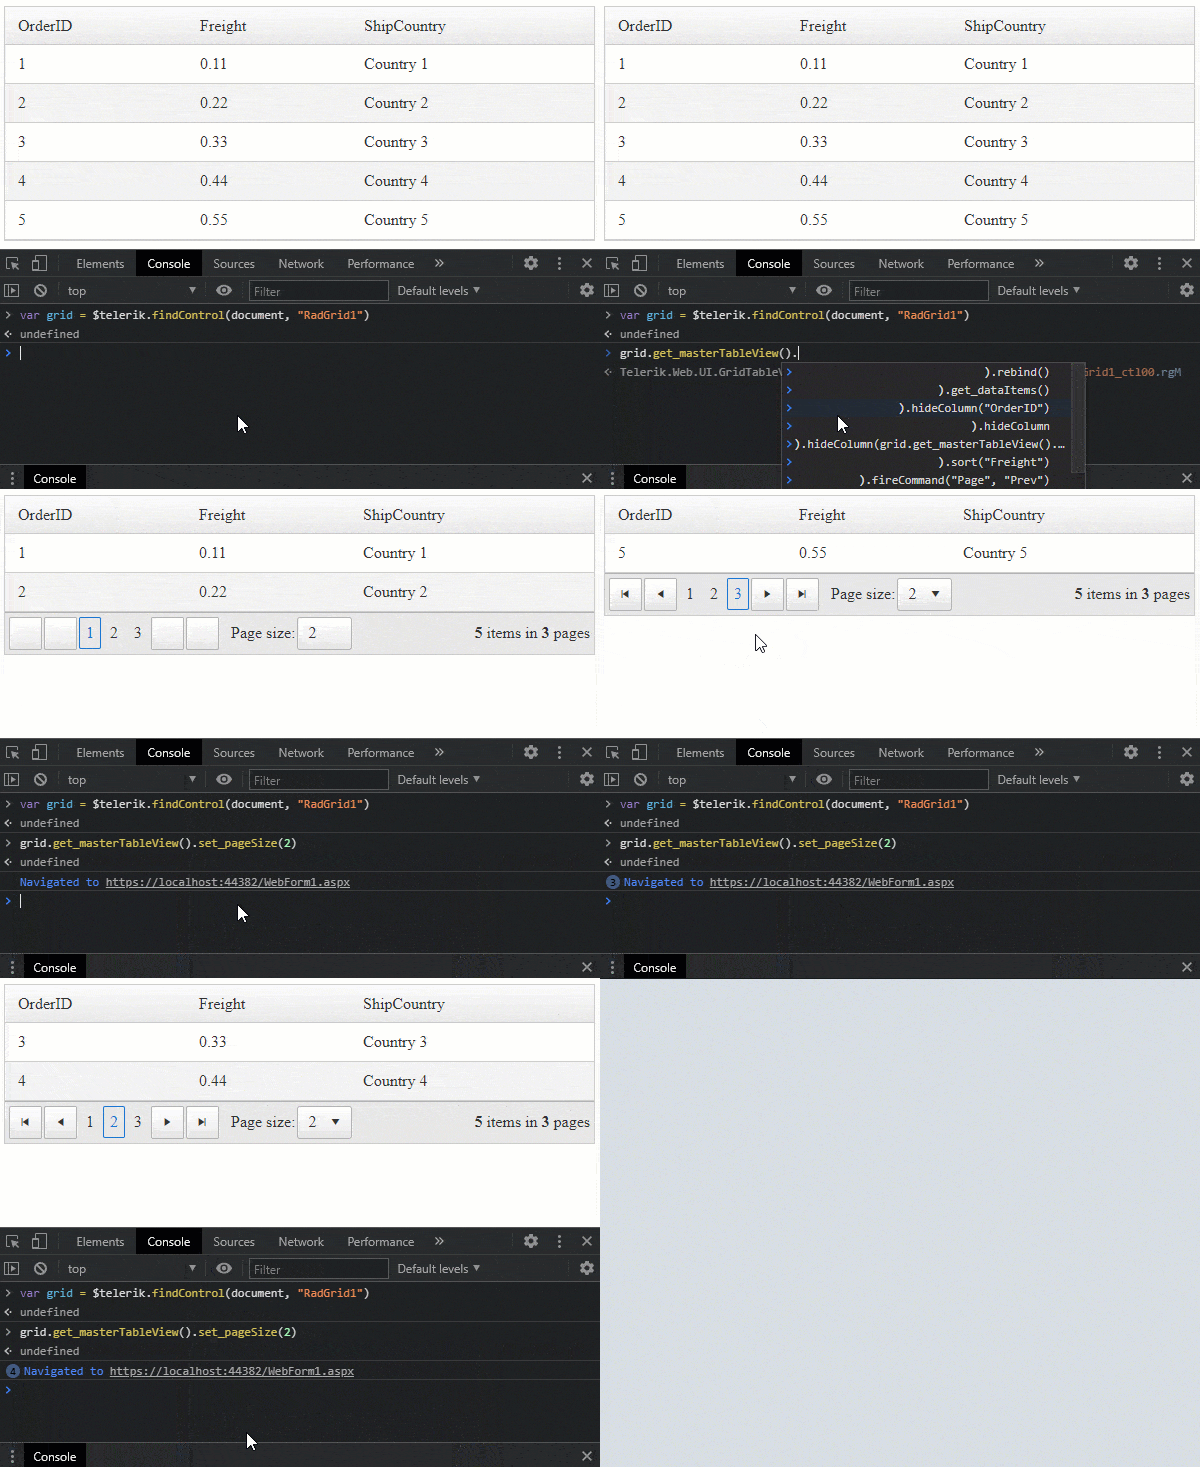
The following example shows changing the PageSize using the set_pageSize() client-side method of the TableView object.
Switch to Another Page
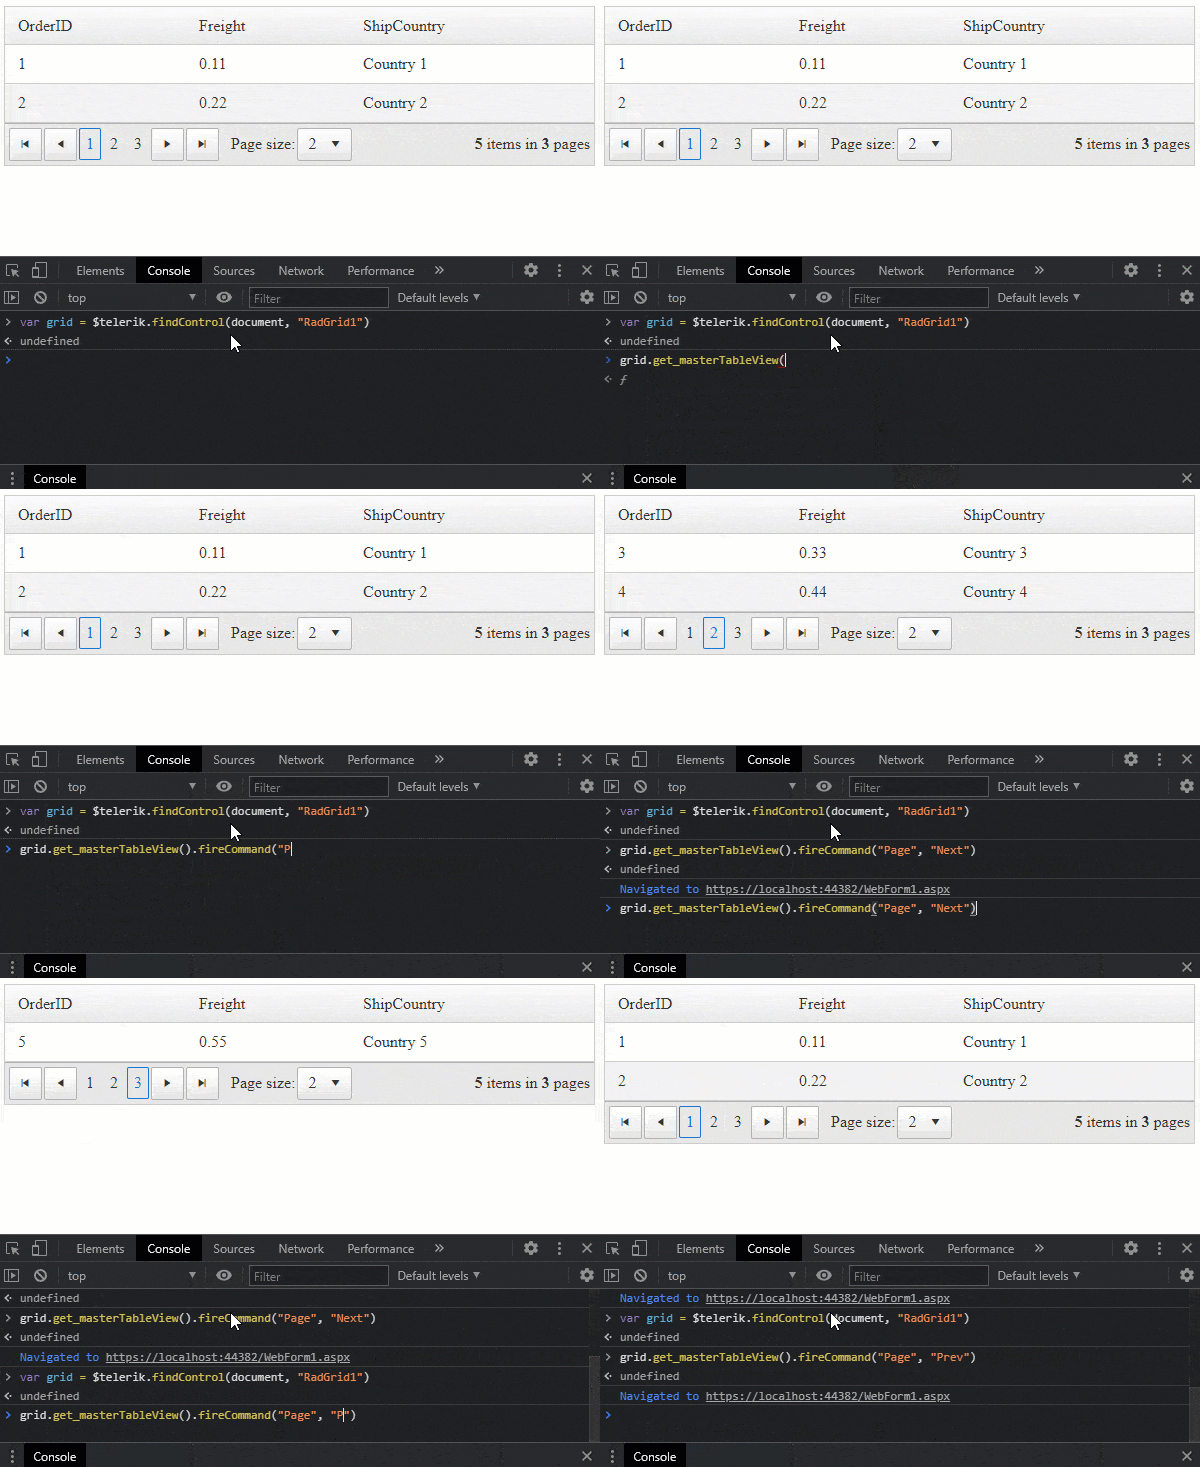
Here is an example of changing the Current Page Index using the set_currentPageIndex() method.
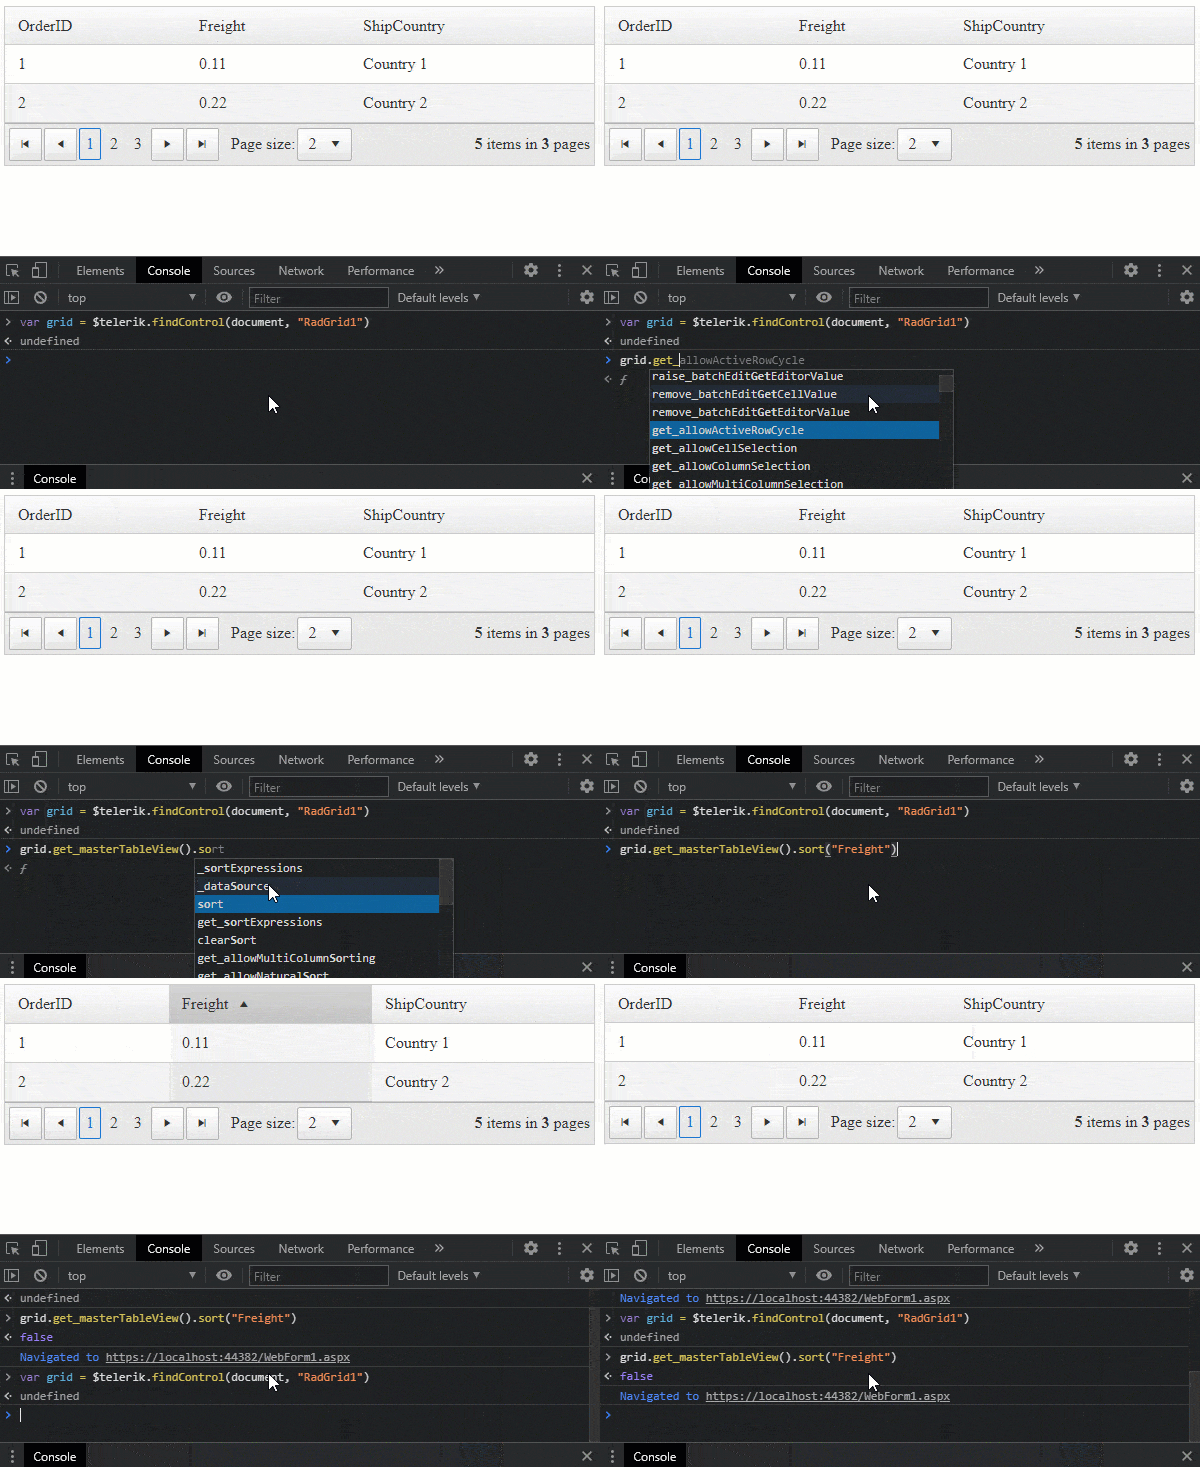
Sort a Column
And here is an example sorting using the sort() function of the TableView Object.
Debugger
The statement we can’t live without while developing our JavaScript Code. That is the debugger;.
Using this powerful statement, we can easily pause the execution of our script at an exact line we want and inspect the JavaScript code from before this line.
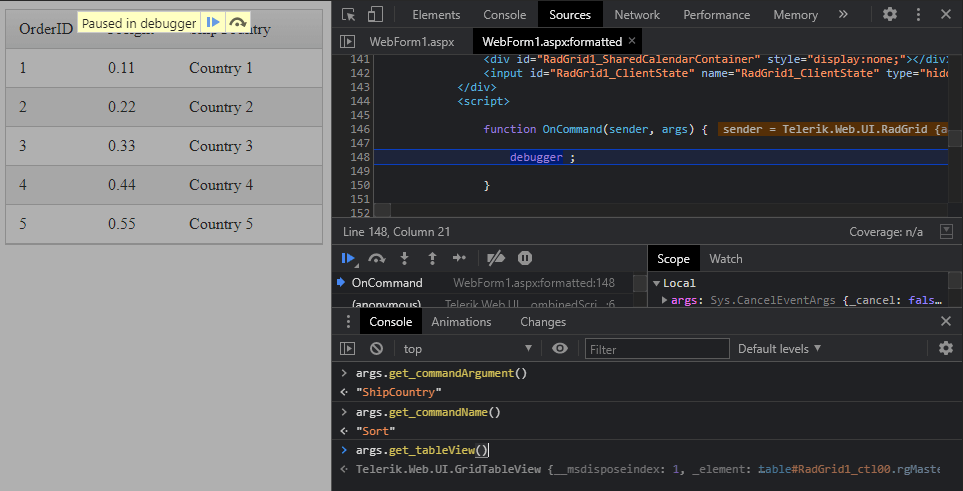
Let’s imagine you were to understand what happens with the Grid upon clicking on the Sort button, expand, filter, etc. You could simply attach the OnCommand client-side event to the Grid, and use the debugger statement.
<telerik:RadGrid ID="RadGrid1" runat="server"> <ClientSettings> <ClientEvents OnCommand="OnCommand" /> </ClientSettings></telerik:RadGrid>JavaScript
function OnCommand(sender, args) { debugger;}The execution of the function will stop exactly at the “debugger” statement, and you will be able to inspect the arguments that are supplied to this function. Use the Console tab and inspect the arguments.
Conclusion
You can’t escape bugs no matter how fast you run, so picking a debugging technique that works best for you is vital. In this article, I have covered a few client-side debugging tips and tools, which, when combined, can make your life easier and help you improve your development workflow.
If you’re interested to learn more, I would recommend checking out these useful resources:
- Improve Your Debugging Skills with Chrome DevTools
- 6 Server-Side Debugging Tips That Will Make Developing Easier
- Get Client-side Reference to a Control Object
- RadGrid Client-Side Programming
Your Thoughts
What’s your preferred debugging technique? If you’d like more advanced debugging tips and tricks, share your feedback, requests and ideas in the comments section below.