Let’s build a climate view UI component in Vue.js using Kendo UI, completing the interface with chart components.
First, a little bit of background.
What is Kendo UI
Kendo UI is a comprehensive web user interface framework with a collection of JavaScript UI components with libraries for jQuery and even more modern ones like Vue, React and Angular. Kendo UI developers build interactive and responsive high-performance apps using a large library of UI widgets and data visualization components.
Why Kendo UI
Using Kendo UI you can easily add really advanced UI components into your frontend project in the library of your choice. You get to save time from worrying about key functionalities of the interface and focus on proprietary features instead. Kendo UI ships with support for each of your favorite frontend web frameworks like Vue.js with an easy-to-use integration.
Also besides basic UI components, Kendo UI provides you with advanced data visualization UI elements that ensure you do not have to add additional libraries to your project to handle charts and graphs. These advanced UI elements are also very customizable too.
What You Will Build

You will be building a climate view UI component in Vue.js using Kendo UI. We will start by scaffolding it with the Kendo UI starter extension in VS Code and then use Vue Router to create routes and finally use some Kendo UI chart components to build the interface.
Getting Started
I’m assuming you already have Vue installed; if not go to the installation guide. Now, let’s open up your VS Code. The first thing we are going to do is to install the Kendo UI template wizard extension. You can do that by going to the extensions tab of VS Code and searching for “Kendo UI Template.” Go ahead and download it, and after restarting VS Code you can now use it to scaffold new projects.
How to Use
- Open VSCode
- Press ctrl+shift+p in Windows/Linux or ⇧⌘P in Mac to open VSCode’s extension launcher
- Type/Select
Kendo UI Template Wizard: Launchand pressEnterto launch the extension

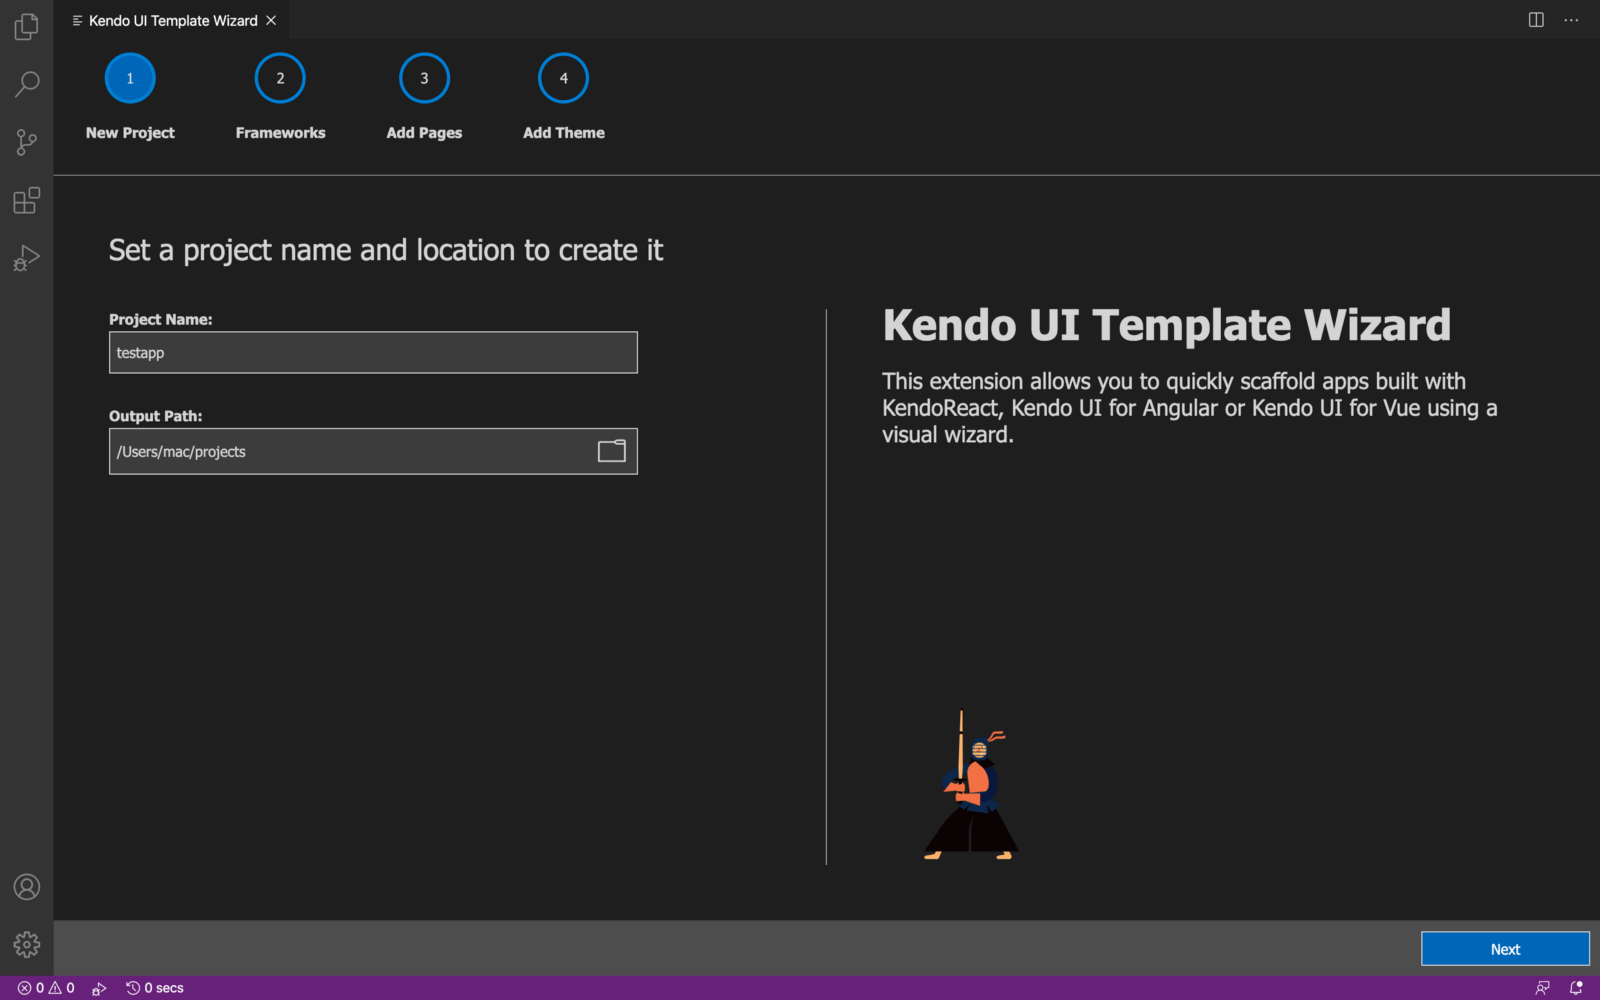
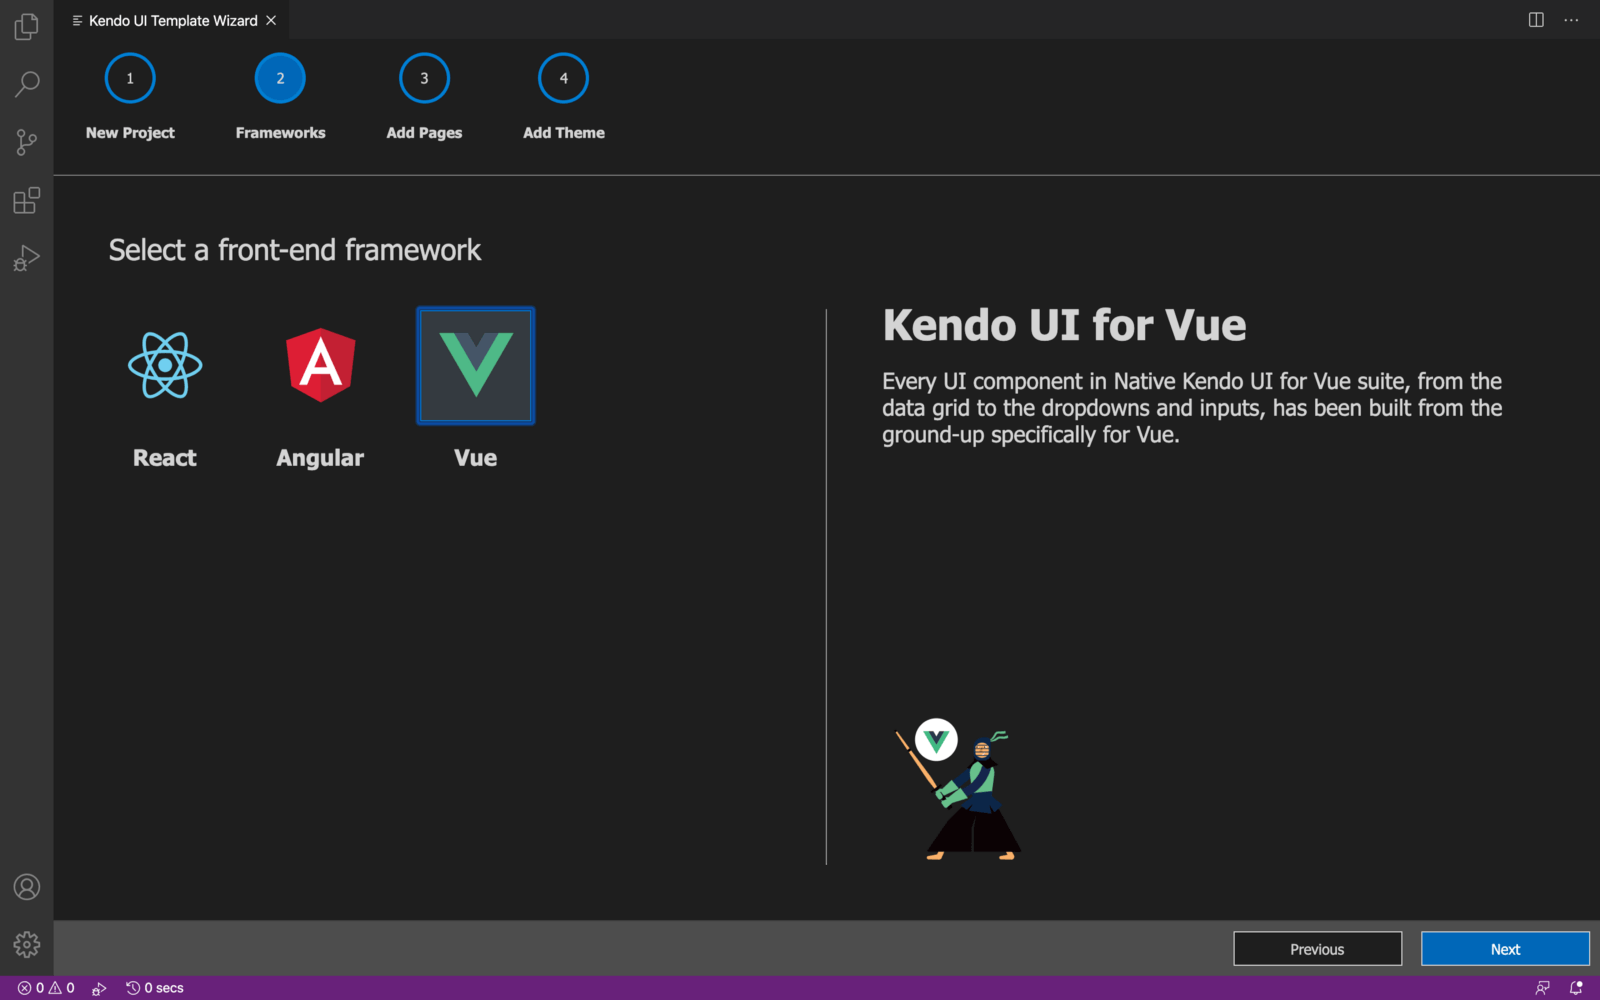
You can start by choosing a project name and a folder where it will be located. When you click Next you are prompted to choose the frontend library you would like to use. Kendo UI has component elements for Vue, Angular and React.

The next stage is to choose the pages you want on your new project. For this project you can choose one chart with routing. Once you make a choice, the template wizard will run the Vue create command in the background and scaffold a Vue application for you.
Setting up
Now that you are done with scaffolding the application, you have to ensure all dependencies are properly installed by running these commands:
cd newapp
npm install
Navigate to the root directory of the new app and in the main.js file ensure it looks exactly like this:
import Vue from 'vue'
import App from './App.vue'
import router from "./router";
Vue.config.productionTip = false
new Vue({
  render: h => h(App),
  router
}).$mount('#app')
You can see that routing has been introduced to the project. In the case that you did not use the Kendo UI template wizard or you chose a blank project, you can add routing easily with the command below in the terminal of the project:
vue add router
In the app.vue file, replace the content with the code block below:
<template>
  <div id="root">
      <div class="content">
          <router-view></router-view>
    </div>
  </div>
</template>
<script>
export default {
  name: 'app',
  components: {
}
}
</script>
The router that was imported has now been brought in here. If you open the router folder, you will see the router script (index.js) where the routes have been registered. Make sure that yours looks like this:
import Vue from "vue";
import Router from "vue-router";
import Home from "../components/Home";
import Chart1 from "../components/Chart1";
import Chart2 from "../components/Chart2";
Vue.use(Router);
export default new Router({
  mode: "history",
  routes: [
    {
      path: "/",
      name: "Home",
      component: Home
    }
    ,{
      path: "/Chart1",
      name: "Chart1",
      component: Chart1
    },{
      path: "/Chart2",
      name: "Chart2",
      component: Chart2
    }
  ]
});
Now when you look at the app.vue file, you will see where these defined routes are brought in. To define these individual routes, navigate to the components folder. You will see a lot of components. Delete all the components leaving just the home component.
Adding Single Components
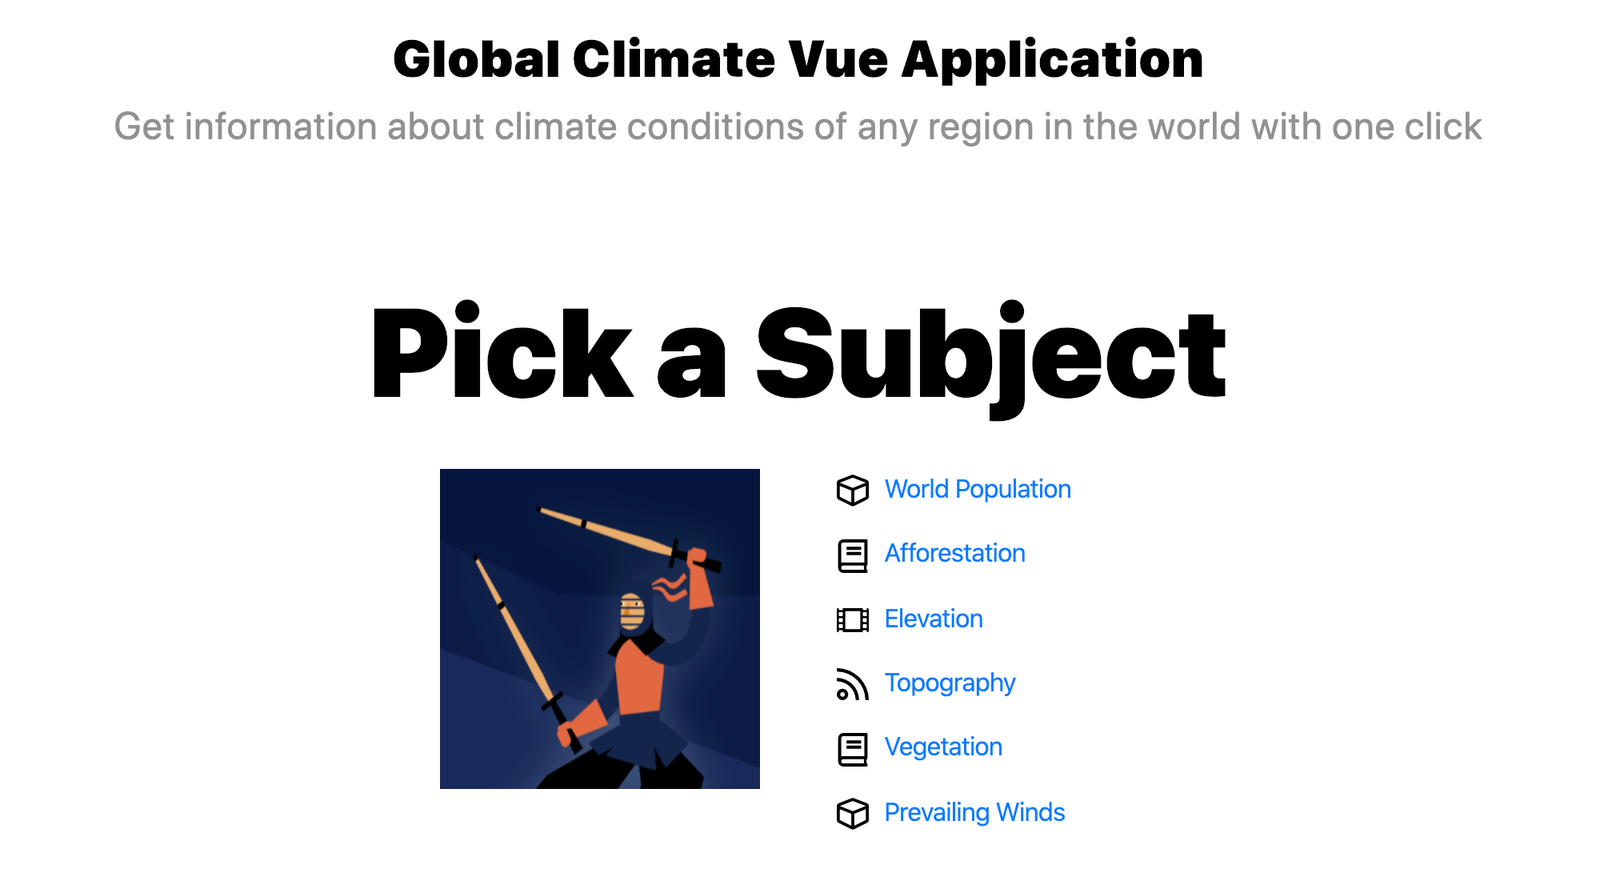
Your home component home.vue should look like this code block below:
<template>
        <div class="container mt-5">
            <div class='row'>
                <div class='col-12'>
                    <h1 class='welcome mb-0'>Global Climate Vue Application</h1>
                    <h2 class='sub-header mt-0'>Get information about climate conditions of any region in the world with one click</h2>
                </div>
            </div>
            <div class='row'>
                <div class='col-12'>
                    <h1 class='get-started'>Pick a Subject</h1>
                </div>
            </div>
            <div class='row justify-content-center'>
                <div class='col-6 text-right'>
                    <div class='kendoka-div'>
                        <img class='kendoka' src="https://www.telerik.com../assets/images/kendoka-vue.svg" alt='kendoka' />
                    </div>
                </div>
                <div class='col-6 components-list'>
                    <p>
                    <img src="https://www.telerik.com../assets/images/components.svg"  alt='components' />
                       <router-link to="/Chart1">World Population</router-link>
                    </p>
                    <p>
                        <img src="https://www.telerik.com../assets/images/styles.svg" alt='styles' />
                        <router-link to="/Chart1">Afforestation</router-link>
                    </p>
                    <p>
                        <img src="https://www.telerik.com../assets/images/blogs.svg" alt='blogs' />
                        <router-link to="/Chart1">Elevation</router-link>
                    </p>
                    <p>
                        <img src="https://www.telerik.com../assets/images/tutorials.svg" alt='tutorials' />
                        <router-link to="/Chart1">Topography</router-link>
                    </p>
                    <p>
                        <img src="https://www.telerik.com../assets/images/styles.svg" alt='styles' />
                        <router-link to="/Chart1">Vegetation</router-link>
                    </p>
                    <p>
                    <img src="https://www.telerik.com../assets/images/components.svg"  alt='components' />
                        <router-link to="/Chart1">Prevailing Winds</router-link>
                    </p>
                </div>
            </div>
        </div>
</template>
<script>
export default {
     data: function() {
        return {
            publicPath: process.env.BASE_URL
        }
    }
}
</script>

Adding Chart Routes
You might encounter errors which might be asking for the routes you defined in the route script. To create those, create a chart1.vue file inside the components folder and inside it copy the code block below:
<template>
<div class='container-fluid'>
           <div class='row my-4 mt-5'>
                <div class='col-12 col-lg-9 border-right' >
                    <div v-if="loading" class="k-loading-mask">
                        <span class="k-loading-text">Loading</span>
                        <div class="k-loading-image"></div>
                        <div class="k-loading-color"></div>
                    </div>
                     <Chart :title-text="'World Population'"
                                :title-font="'19pt sans-serif'"
                                :title-margin-bottom="50"
                                :legend-position="'bottom'"
                                :series="series"
                                :theme="'sass'">
                    </Chart>


                </div>

                <div class='col-12 col-lg-3 mt-3 mt-lg-0'>
                     <h2>View by Continent</h2>
                    <ul>
                        <li>
                            <h3><router-link to="/Chart2">Asia</router-link></h3>
                        </li>
                        <li>
                            <h3><router-link to="/Chart2">Africa</router-link></h3>
                        </li>
                        <li>
                            <h3><router-link to="/Chart2">North America</router-link></h3>
                        </li>
                        <li>
                            <h3><router-link to="/Chart2">South America</router-link></h3>
                        </li>
                        <li>
                            <h3><router-link to="/Chart2">Australia</router-link></h3>
                        </li>
                    </ul>
                </div>
            </div>
        </div>
</template>
<script>
import '@progress/kendo-ui/js/kendo.dataviz.chart'
import { Chart } from '@progress/kendo-charts-vue-wrapper';
export default {
     mounted: function(){
        setTimeout(() => {
            this.loading = false;
        }, 300);
     },
     components: {
        Chart
     },
     data: function() {
        return {
            loading: true,
            series: [{
                    type: "pie",
                    labels: {
                        visible: true,
                        format: "p0"
                    },
                    connectors: {
                      width: 0
                    },
                    data: [
                      { category: 'EUROPE', value: 0.09 },
                      { category: 'NORTH AMERICA', value: 0.06 },
                      { category: 'AUSTRALIA', value: 0.02 },
                      { category: 'ASIA', value: 0.60 },
                      { category: 'SOUTH AMERICA', value: 0.06 },
                      { category: 'AFRICA', value: 0.17 }
                    ]
            }]
        }
    }
}
</script>
Here we use the Kendo UI chart component that comes with a special animation as it opens up to define continents according to their population. Kendo UI integrates beautifully with Vue, and you can add a lot of options in the Vue return function of a particular component.
For the second route, create a Chart2.vue file inside the components folder and copy the code block below inside it:
<template>
<div style="width: 600px" class="container-fluid col-12 col-lg-9 mt-5">
<h2 style="text-align:center;margin:60px;">Climate Report for Africa</h2>
<div class="climate ">
<h3>Climate control history</h3>
<table class="history">
<tr>
<td class="spark">
<kendo-sparkline :data="pressLogData" :theme="'sass'"></kendo-sparkline>
</td>
<td class="value">980
<span>mb</span>
</td>
</tr>
<tr>
<td class="spark">
<kendo-sparkline :type="'column'"
:data="tempLogData"
:tooltip-format="'{0} %'"
:theme="'sass'">
</kendo-sparkline>
</td>
<td class="value">21
<span>°C</span>
</td>
</tr>
<tr>
<td class="spark">
<kendo-sparkline :type="'area'"
:data="humLogData"
:tooltip-format="'{0} %'"
:theme="'sass'">
</kendo-sparkline>
</td>
<td class="value">32
<span>%</span>
</td>
</tr>
</table>
</div>
<div class="temperature">
<h3>Temperature control</h3>
<div class="stats">
<kendo-sparkline id="temp-range"
:type="'bullet'"
:data="tempRangeData"
:tooltip-visible="false"
:value-axis="tempRangeValueAxisOpt"
:theme="'sass'">
</kendo-sparkline>
</div>
</div>
<div class="conditioner">
<h3>Conditioner working time</h3>
<ul class="pie-list stats">
<li>
MON
<kendo-sparkline id="stats-mon"
:type="'pie'"
:data="[14,10]"
:theme="'sass'">
</kendo-sparkline>
</li>
<li>
TUE
<kendo-sparkline id="stats-tue"
:type="'pie'"
:data="[8,6]"
:theme="'sass'">
</kendo-sparkline>
</li>
<li>
WED
<kendo-sparkline id="stats-wed"
:type="'pie'"
:data="[8,16]"
:theme="'sass'">
</kendo-sparkline>
</li>
<li>
THU
<kendo-sparkline id="stats-thu"
:type="'pie'"
:data="[12,12]"
:theme="'sass'">
</kendo-sparkline>
</li>
<li>
FRI
<kendo-sparkline id="stats-fri"
:type="'pie'"
:data="[6,18]"
:theme="'sass'">
</kendo-sparkline>
</li>
<li>
SAT
<kendo-sparkline id="stats-sat"
:type="'pie'"
:data="[1,23]"
:theme="'sass'">
</kendo-sparkline>
</li>
<li>
SUN
<kendo-sparkline id="stats-sun"
:type="'pie'"
:data="[5,19]"
:theme="'sass'">
</kendo-sparkline>
</li>
</ul>
</div>
</div>
</template>
<script>
import Vue from 'vue'
import '@progress/kendo-ui';
import { KendoSparkline } from '@progress/kendo-charts-vue-wrapper';
Vue.component('kendo-sparkline', KendoSparkline);
export default {
components: {
KendoSparkline
},
data: function() {
return {
pressLogData: [
936, 968, 1025, 999, 998, 1014, 1017, 1010, 1010, 1007,
1004, 988, 990, 988, 987, 995, 946, 954, 991, 984,
974, 956, 986, 936, 955, 1021, 1013, 1005, 958, 953,
952, 940, 937, 980, 966, 965, 928, 916, 910, 980
],
tempLogData: [
16, 17, 18, 19, 20, 21, 21, 22, 23, 22,
20, 18, 17, 17, 16, 16, 17, 18, 19, 20,
21, 22, 23, 25, 24, 24, 22, 22, 23, 22,
22, 21, 16, 15, 15, 16, 19, 20, 20, 21
],
humLogData: [
71, 70, 69, 68, 65, 60, 55, 55, 50, 52,
73, 72, 72, 71, 68, 63, 57, 58, 53, 55,
63, 59, 61, 64, 58, 53, 48, 48, 45, 45,
63, 64, 63, 67, 58, 56, 53, 59, 51, 54
],
tempRangeData: [21, 23],
tempRangeValueAxisOpt: {
min: 0,
max: 30,
plotBands: [{
from: 0, to: 15, color: '#787878', opacity: 0.15
}, {
from: 15, to: 22, color: '#787878', opacity: 0.3
}, {
from: 22, to: 30, color: '#787878', opacity: 0.15
}]
}
}
}
}
</script>
<style>
.temperature, .conditioner {
margin: 0;
padding: 30px 0 0 0;
}
.history {
border-collapse: collapse;
width: 100%;
}
.history td {
padding: 0;
vertical-align: bottom;
}
.history td.spark {
line-height: 30px;
}
.history td.value {
font-size: 1.6em;
font-weight: normal;
line-height: 50px;
}
.history td.value span {
font-size: .5em;
vertical-align: top;
line-height: 40px;
}
.stats {
text-align: center;
}
.pie-list {
margin: 0;
padding: 0;
list-style-type: none;
}
.pie-list li {
display: inline-block;
text-align: center;
width: 34px;
font-size: 12px;
}
#stats-mon,
#stats-tue,
#stats-wed,
#stats-thu,
#stats-fri,
#stats-sat,
#stats-sun {
display: block;
width: 40px;
line-height: 35px;
}
#temp-range {
width: 100%;
line-height: 40px;
}
</style>
This second route makes use of the Kendo UI Sparkline component to portray climate conditions. Tying everything together, you can now run the app in the dev server with the command:
npm run serve
And you will have a fully functioning UI component with routing and all the pre-defined charts.
Conclusion
This post is an introduction to Kendo UI for Vue.js and how you can easily start a Vue project using the Kendo UI template wizard. It also shows how easy it is to implement Vue routing and to bring in Kendo UI components into your Vue projects. Happy hacking!