Here's our guide for embedding reports into Angular applications. In this step-by-step tutorial, you will learn how to embed reporting into Angular applications using the Telerik Report Viewer.
In this step-by-step tutorial, I will demonstrate how to use Telerik Report Viewer in Angular applications. This tutorial covers the following topics:
- What is Telerik Report Viewer?
- How can it be integrated with an app?
- How to implement the Report Viewer in Angular
- Report Viewer toolbar
- Conclusion
What is Telerik Report Viewer?
The Telerik Report Viewer is a pure HTML5/JavaScript/CSS3 jQuery-based widget that allows displaying Telerik reports in an HTML page. The layout or styling is based on pure HTML5 templates and CSS3 styles and is fully customizable. It supports mobile as well as desktop browsers. Report viewers, which are UI components, allow you to display the report document produced by the report engine in the application UI.
How Can it Be Integrated with an App?
To integrate the Telerik Report Viewer in an Angular application, you'll need to follow these prerequisites:
- Angular Report Viewer requirements
- Node
- Angular CLI
- A running Telerik Reporting REST Service endpoint to use in an Angular application (find more info here)
Grab the eBook: A Quick Guide to Expert .NET Reporting Tools
How to Implement the Report Viewer in Angular
The Telerik Report Viewer provides a component that can be used in Angular applications. Following are the steps to use this component in Angular:
Step 1: Create an Angular application using the Angular CLI by running the below command:
> ng new my-app
Step 2: Install the Telerik Angular Report Viewer npm package by running the below command:
> npm install @progress/telerik-angular-report-viewer
Step 3: Next, import the TelerikReportingModule in your application root module.
import  {  TelerikReportingModule  }  from  '@progress/telerik-angular-report-viewer';

//add into the imports array
imports:  [TelerikReportingModule]
Step 4: Add the Report Viewer container style using a property of the AppComponent class:
viewerContainerStyle =  {
    position:  'relative',
    width:  '1000px',
    height:  '800px',
    left: '5px',
    right: '5px',
    ['font-family']:  'ms sans serif'
};
Step 5: Add the Telerik Report Viewer provided component (i.e. tr-viewer in AppComponent template):
<tr-viewer  #viewer1
[containerStyle]="viewerContainerStyle"
[serviceUrl]="'http://localhost:12345/api/reports/'"
[reportSource]="{
    report: 'Product Line Sales.trdp',
    parameters: { CultureID: 'en'}
}"
[viewMode]="'INTERACTIVE'"
[scaleMode]="'SPECIFIC'"
[scale]="1.0"
[ready]="ready"
[viewerToolTipOpening]="viewerToolTipOpening"
[enableAccessibility]="false">
</tr-viewer>
Note - For available options for this component, please check details here.
Step 6: The Report Viewer uses the style of the desired Kendo UI theme, so please add the below references to the Less-based CSS files in the head element of index.html:
<!-- The required Less-based styles -->
<link href="https://kendo.cdn.telerik.com/2020.1.114/styles/kendo.common.min.css"  rel="stylesheet"/>
<link  href="https://kendo.cdn.telerik.com/2020.1.114/styles/kendo.blueopal.min.css"  rel="stylesheet"/>
Step 7: Finally, we have implemented the Telerik Report Viewer component in an Angular application. Now, time to run the application by running the command below:
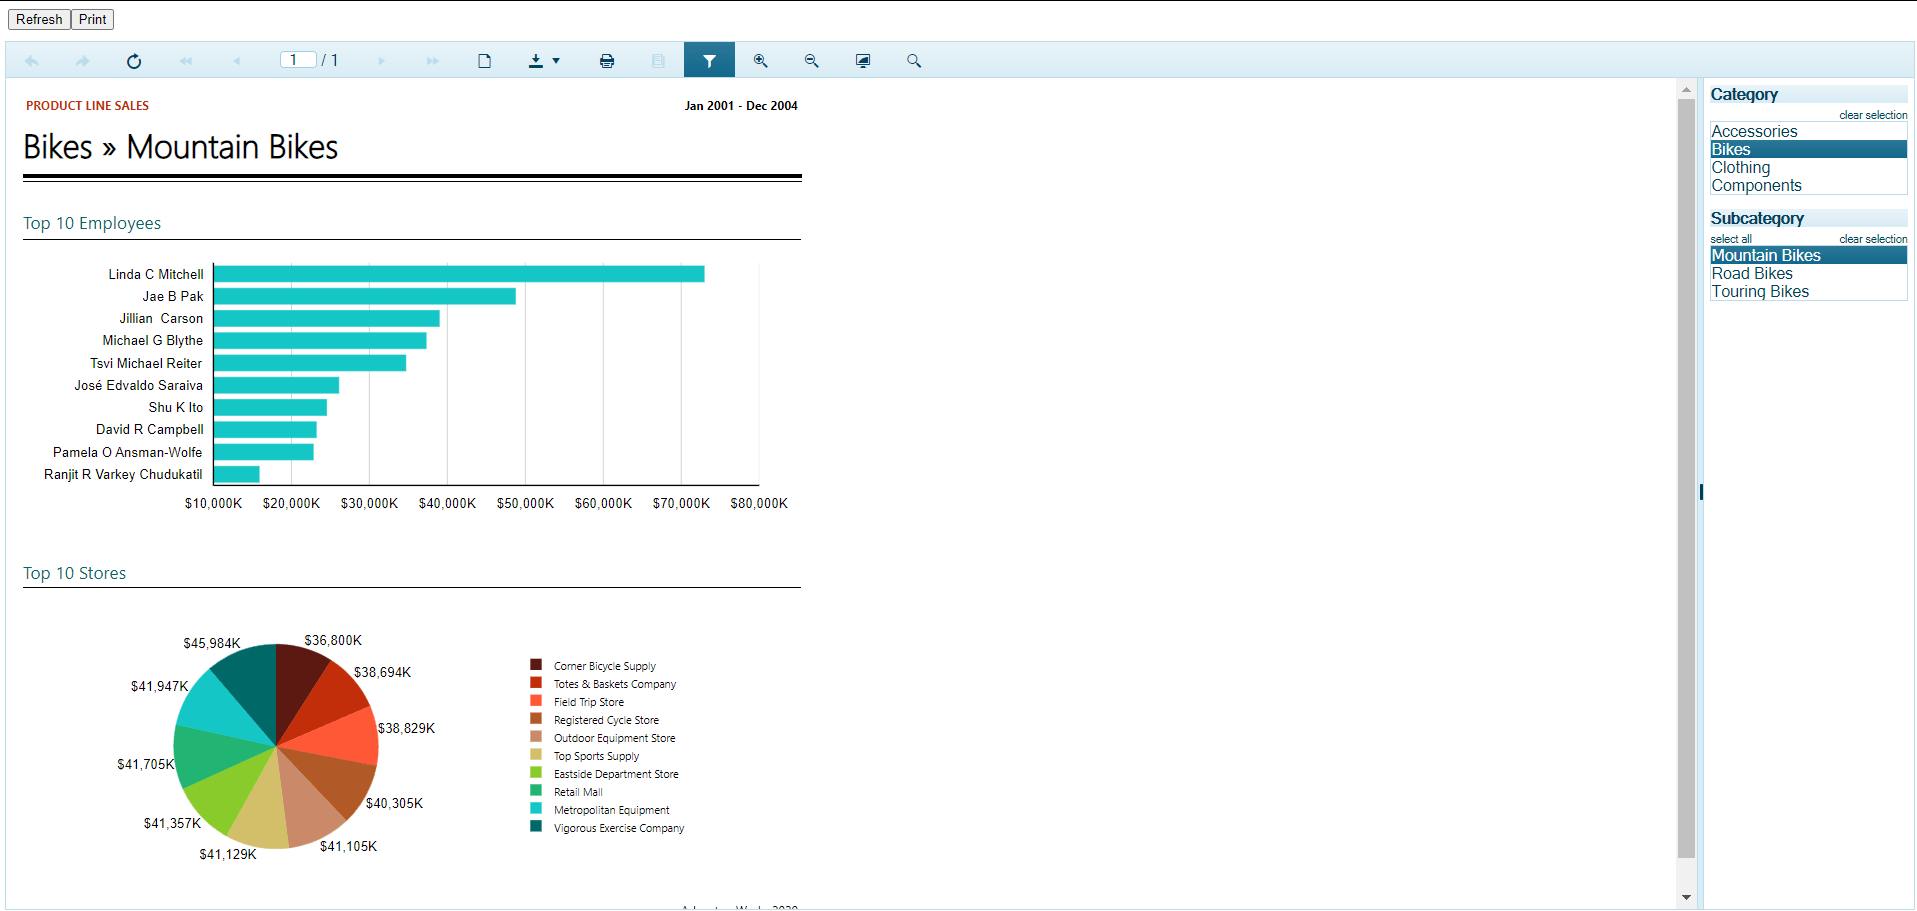
ng serve -oOnce that command runs, it will open the browser and Report Viewer shows the rendered report as the output like this:

In case the report is not shown, please make sure the Reporting REST service is running, following the suggestions in this KB article.
Report Viewer Toolbar
Let's check what tools are available for users in the Report Viewer toolbar.
Top toolbar options:

- Forward/Backward
- Refresh report
- Page number selector
- Toggle print preview
- Download
- Excel
- Text
- TIFF
- Web Archive
- XPS Document
- Zoom - In/Out
- Toggle - FullPage/PageWidth
- Search in report contents
- Toggle the document map area
- Print report
- Toggle filter
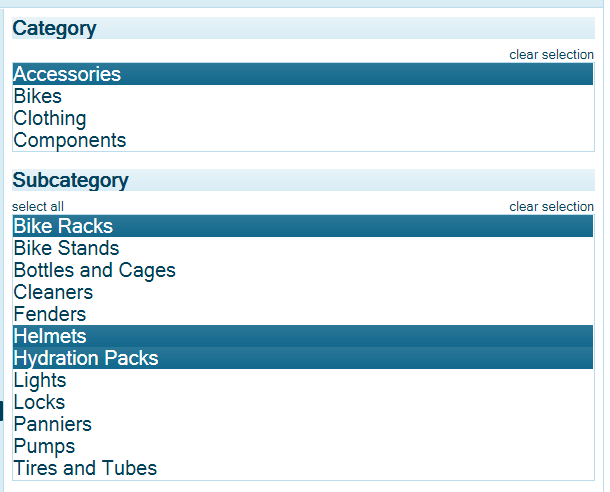
Filters—The below screenshot shows the filters on the right side of the Report Viewer. Based on these filters, data will be shown in the left side.

You can also download this example from here.
Save Your Seat: Reporting In-Depth—How to Streamline Reporting with Ease
Conclusion
In this article, we discussed what the Telerik Report Viewer is, its prerequisites and how to use it working in an Angular application, and the Report Viewer toolbar for users. If you have any suggestions or queries regarding this article, please contact me.
"Learn it, Share it."
Tried Telerik DevCraft?
You can choose Telerik Reporting and Telerik Report Server as individual products or enjoy them as part of the great Telerik DevCraft bundles.
Telerik DevCraft is the finest software developer tools collection across .NET and JavaScript technologies, which includes modern, feature-rich and professionally designed UI components for web, desktop and mobile applications, reporting and report management solutions, document processing libraries, automated testing and mocking tools from the Telerik and Kendo UI suites. DevCraft will arm you with everything you need to deliver outstanding applications in less time and with less effort. With the backing of our legendary support team, which consists of the developers who build the products, and a ton of resources and trainings you can rest assured that you have a stable partner to rely on for your everyday challenges along your software development journey.