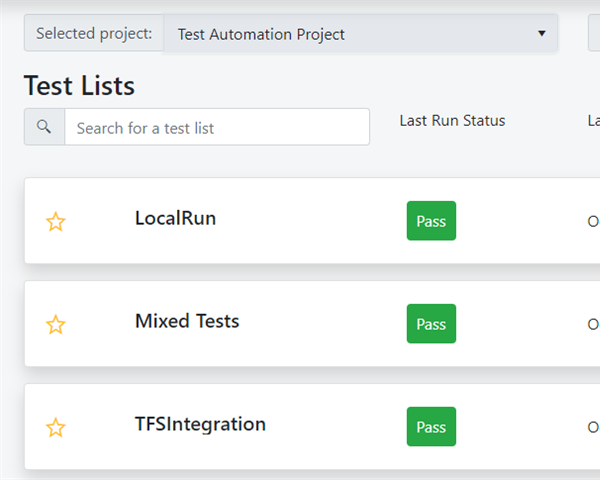
Presenting the Test Studio Executive Dashboard - a web feature to monitor automation results. Anybody on the project can use the Dashboard to monitor automation, and thus product health, from any kind of device.
Hey there! I am so excited to share more details with you about one of the newest and coolest Test Studio features from the R3 2019 release. Along with nice features for QAs—such as Blazor Applications support and the ability to create and execute Test Studio test lists in Visual Studio—we’ve decided to please the other stakeholders in a project (like PM and Management) and provide them the ability to check the automation results live via a web page.
Let me introduce you to the Executive Dashboard.
Until now, in order to check Test Studio results you had to have either Test Studio or Results Viewer installed or have them send via email. This made it harder, especially for the non-technical people, to review the results, make a report and so on.
With the Executive Dashboard anyone with the link within the same network can monitor the automation results, drill down test lists and test results and review the exceptions of the failed tests.
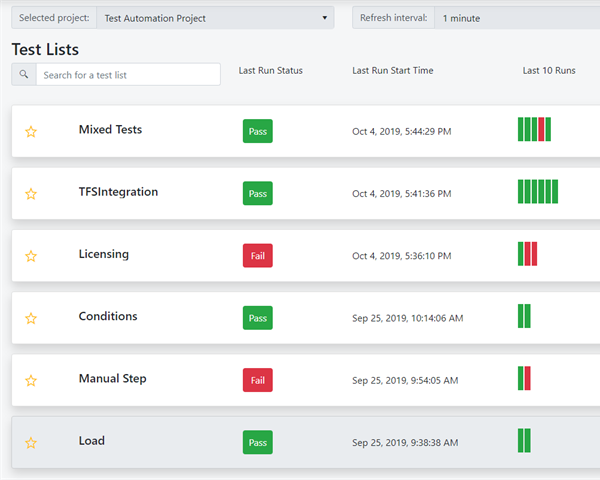
The index page of the Executive Dashboard looks like this:
It works in all browsers and has a responsive design so you can load the page using your mobile phone or tablet.
Prerequisites for the Executive Dashboard
The Executive Dashboard pulls all the data from the scheduling database, and in order to take advantage of this feature you will need the following prerequisites:
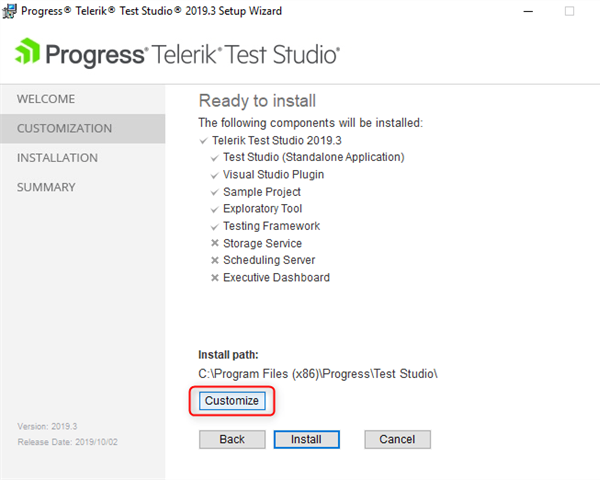
- Storage Service
- Scheduling Server
- Executive Dashboard
For the sake of this example we will perform an all-in-one installation, this means that all the features can be installed on different machines, depending on your preferences.
Once you launch the Test Studio installer and accept the license agreement, click on the Customize button to turn on the features mentioned above.
To perform the installation you can follow the installation procedure as described in this KB article. Once you perform the installation you need to configure the Scheduling environment and execute a test list remotely to have the results appear in the Executive Dashboard.
Refer to this KB article for more information on setting up the scheduling and executing a test list remotely.
You may have a question, “What about local results?” and that’s a reasonable one. Of course we have solution for this. In Test Studio you have the option to upload any local results in the scheduling database and have it displayed in the Executive Dashboard.
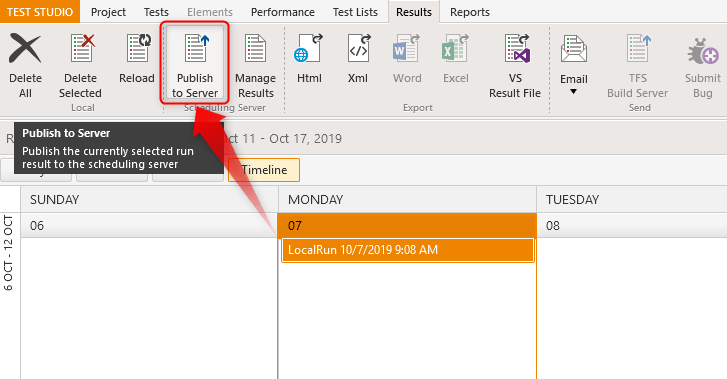
You simply navigate to the result in question, select it and click on Publish to Server button.
Note: You should have the scheduling set up as shown in the KB article above, otherwise thePublish to Server button will be disabled.
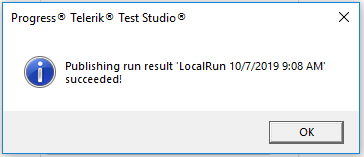
You get confirmation that publishing the run result succeeded:
And the result appears on top in the Executive Dashboard.
3 Useful Features You Should Know about the Executive Dashboard
- The Executive Dashboard displays test list runs per project. You can drill down to Test List results and Test Results by selecting the Test List run. If you have multiple projects use Selected Project dropdown to switch between projects:
![Select Project Select Project]()
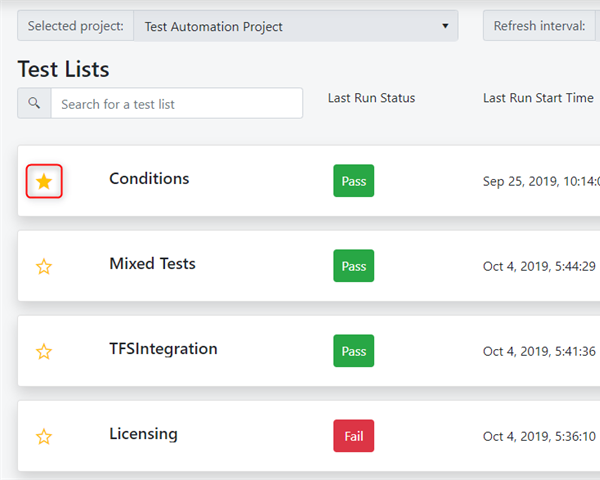
- You can add a test list run to favorites by clicking the star icon on the left. The run results are sorted by default by Last Run Start Time, until a favorite is added. Then it is displayed on the top no matter the Last Run Start Time. The rest of the runs use the default sorting.
![add run to favorites add run to favorites]()
As you can see from the screenshot above, even though the last run of Conditions is executed on the 25th of September, it is added to favorites so it's placed on top of the runs executed on October 4th. Even if you switch projects the favorite runs are saved per project. - You can use the refresh interval dropdown to select the time on how often the list of the run has to be refreshed. This is added to make things easier for you by eliminating the need to manually refresh. This is extremely helpful if you have dedicated screens/monitors for test results, so this way you can monitor results without taking any additional action.
Along with monitoring the automation results, in the Executive Dashboard you can drill down into each run, test list or single test, to investigate any failures and issues.
You can learn more about the Executive Dashboard over on this this KB article.