In this tutorial, we’ll be building a real-time chart application. Using our application, users can visualize data on their dashboard in real time without having to refresh their browser. We’ll be using Socket.io and nodeJS as our server to get real-time updates and HTML, CSS, jQuery and Kendo UI for creating the user interface.
Real-time applications are programs that function within a time frame that the user senses as immediate, current or instant. On Facebook when you send a message, the recipient receives it without having to refresh his browser. On Instagram when someone likes your photo, you immediately receive a prompt without any action on your part. Some other examples of real-time applications are live charts, multiplayer games, project management and collaboration tools, and monitoring services.
In this tutorial, we’ll be building a real-time chart application. Using our application, users can visualize data on their dashboard in real time without having to refresh their browser. We’ll be using Socket.io and nodeJS as our server to get real-time updates and HTML, CSS, jQuery and Kendo UI for creating the user interface.
Prerequisites
To follow this tutorial, a basic understanding of jQuery and Node.js is required. Also ensure that you have at least Node version 8+ installed on your development machine before you begin. HTML/CSS knowledge is also recommended but not mandatory.
To build the required application, here are a few tools we’ll use:

Initializing the Application
When dealing with static data or data that doesn’t get updated frequently, building the dashboard with HTML, CSS and jQuery might be the best solution. However, when dealing with data that gets updated frequently, the need for real-time systems arises. We will use Socket.io to keep the communication line between our server and the client open. We will use Node because we can easily create a minimal server with Express. We will be using a very minimal setup for this project. Lastly we will use Kendo UI’s Chart Component to reduce the amount of code we will write to build a custom one.
Create a folder called kendoUIChart and create a package.json file inside it. Now, add the following code:
// ./package.json{"name":"Kendouichart","version":"1.0.0","description":"Simple app built with node.js and socket.io","main":"app.js","scripts":{"test":"echo \"Error: no test specified\" && exit 1","start":"node app"},"author":"Your Name","license":"ISC","dependencies":{"express":"^4.16.2","socket.io":"^2.2.0"}}Now when you run npm Install, it runs the script and installs all our dependencies. If it ran properly, you should now see a node_modules folder and a package-lock.json file. Now that this is out of the way, let’s go ahead and start writing some code.
In the root directory, create an app.js file. This file will be the entry point of our application. Then create a public folder where we will store our html file and static assets. Inside it, create an index.html file and a js directory and initialize a chart.js file in the directory.
Right now our folder structure should look like this:
    kendouichart/
        node_modules/public/
            js/
             charts.js
            index.html
        app.js
        package.json
        package-lock.json
Open the app.js file and add the following code to it:
// ./app.js const express =require('express')const app =express()//middlewares
    app.use(express.static('public'))//Listen on port 3000
    server = app.listen(3000);
Here, we require Express and initialize it. We then go ahead and use it to serve the files in our public folder. Now whenever you type npm start in the terminal, the files in the public folder get served as your homepage. That’s it for our basic server with Express, now let’s go ahead and create our real-time application. We will revisit this file when we are ready to add real-time features.
Creating the Dashboard with the Kendo UI Chart Component
Open your index.html file in the public folder and add the following lines of code:
<!-- public/index.html --><html><head><linkrel="stylesheet"href="https://kendo.cdn.telerik.com/2019.1.220/styles/kendo.common.min.css"><linkrel="stylesheet"href="https://kendo.cdn.telerik.com/2019.1.220/styles/kendo.rtl.min.css"><linkrel="stylesheet"href="https://kendo.cdn.telerik.com/2019.1.220/styles/kendo.default.min.css"><linkrel="stylesheet"href="https://kendo.cdn.telerik.com/2019.1.220/styles/kendo.mobile.all.min.css"><script src="https://code.jquery.com/jquery-3.3.1.js" integrity="sha256-2Kok7MbOyxpgUVvAk/HJ2jigOSYS2auK4Pfzbm7uH60="crossorigin="anonymous"></script><scriptsrc="https://kendo.cdn.telerik.com/2019.1.220/js/kendo.all.min.js"></script><title>Real Time Chart</title></head><body></body></html>In our index file we have imported 3 things:
- The Kendo UI default stylesheet.
- The latest version of jQuery.
- A minified version of all Kendo UI’s core components.
The main advantage of the CDN approach is that your users may be able to leverage a primed cache version of Kendo UI Core or jQuery if they’ve visited other sites using the framework.
An upside to using the other installation approach is that you can import just the components you need for your application, which can optimize page speed. However, for this demonstration purpose, we will stick to our CDN approach.
Next we need to create a div where Kendo UI will place the chart and then initialize Kendo UI Chart in our js file.
Add the following lines of code to the body of your index.html:
<!-- public/index.html --><divid="example"><divclass="demo-section k-content wide"><divid="chart"></div></div></div><scriptsrc="/js/charts.js"></script>Now open your chart.js file and add the following lines of code:
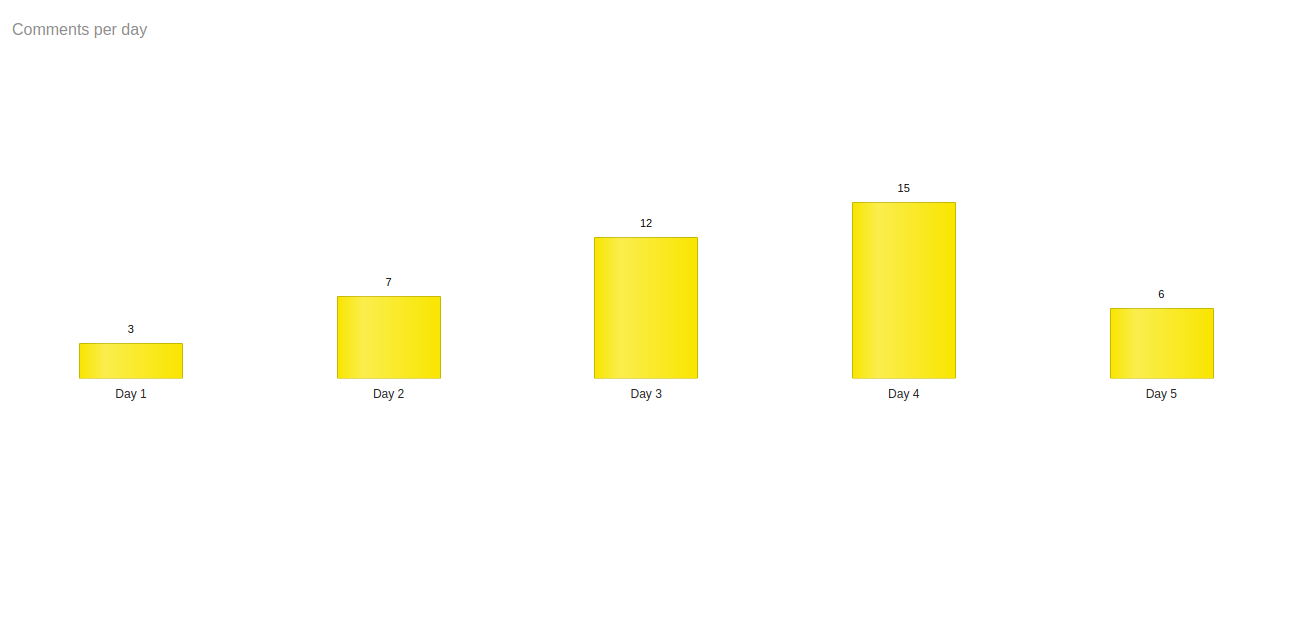
// public/jsfunctioninit(){const blogComments =[{"blog":"My blog","day":"Day 1","value":3,"userColor":"#ffd600"},{"blog":"My blog","day":"Day 2","value":7,"userColor":"#ffd600"},{"blog":"My blog","day":"Day 3","value":12,"userColor":"#ffd600"},{"blog":"My blog","day":"Day 4","value":15,"userColor":"#ffd600"},{"blog":"My blog","day":"Day 5","value":6,"userColor":"#ffd600"}];functioncreateChart(){$("#chart").kendoChart({
                    dataSource:{
                        data: blogComments
                    },
                    title:{
                        align:"left",
                        text:"Comments per day"},
                    legend:{
                        visible:false},
                    seriesDefaults:{
                        type:"column",
                        labels:{
                            visible:true,
                            background:"transparent"}},
                    series:[{
                        field:"value",
                        categoryField:"day",
                        colorField:"userColor"}],
                    valueAxis:{
                        max:28,
                        majorGridLines:{
                            visible:false},
                        visible:false},
                    categoryAxis:{
                        majorGridLines:{
                            visible:false},
                        line:{
                            visible:false}}});}$(document).ready(createChart);$(document).bind("kendo:skinChange", createChart);}$(init);
In this file we create a function called init then we define an array to hold the data we want to display in the chart. Finally we call the kendoChart function and pass it to our datasource after which we initialize it.
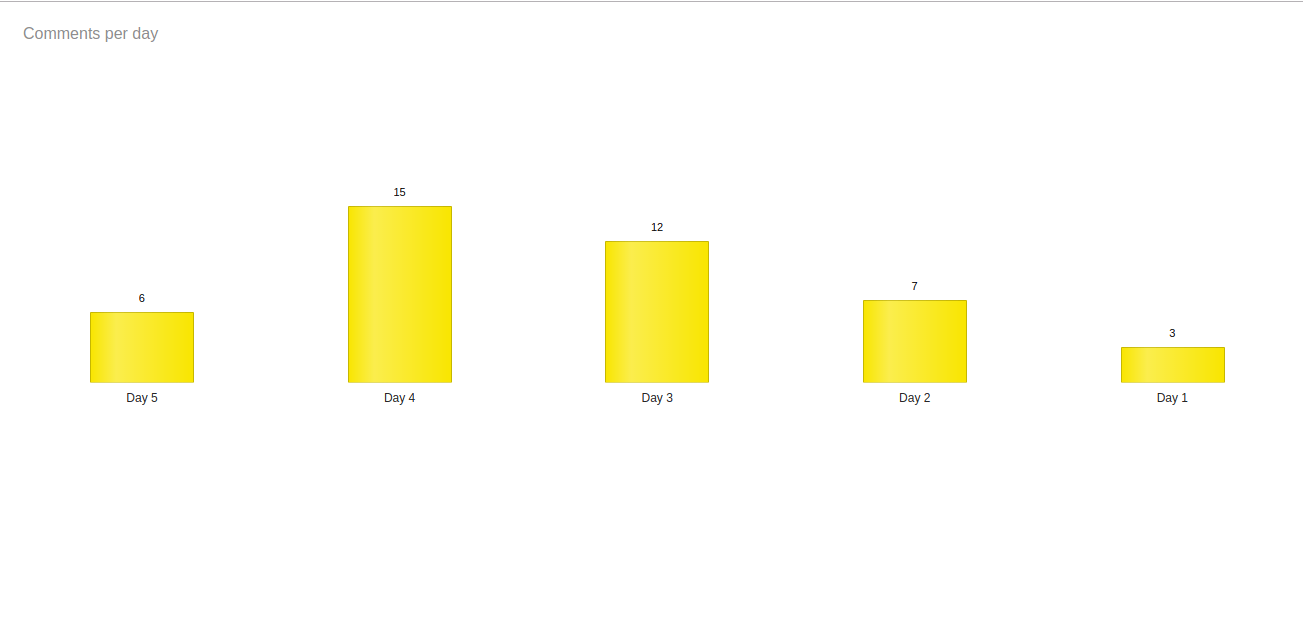
Now start your app by typing npm start in your terminal. Visit http://localhost:3000 in your browser and you should see this:
Going Real-Time with Socket.io
Right now, we have a working application. Next, we need to make it real-time using Socket.io. We already installed Socket.io as one of our node dependencies, so all we need to do is initialize it in our app.js and write some functions. Open up your app.js file and add the following code to it:
// ./app.js//other code//newly added codeconst blogComments =[{"blog":"My blog","day":"Day 1","value":3,"userColor":"#ffd600"},{"blog":"My blog","day":"Day 2","value":7,"userColor":"#ffd600"},{"blog":"My blog","day":"Day 3","value":12,"userColor":"#ffd600"},{"blog":"My blog","day":"Day 4","value":15,"userColor":"#ffd600"},{"blog":"My blog","day":"Day 5","value":6,"userColor":"#ffd600"}];functionswap(arr){return[arr[0], arr[1], arr[2], arr[3], arr[4]]=[arr[4], arr[3], arr[2], arr[1], arr[0]];}const io =require("socket.io")(server)

    io.on('connection',function(socket){setInterval(function(){var data =swap(blogComments)//send data to the client
                   socket.broadcast.emit('updateChart', data);},4000);});
In our app.js we declare our blog comments array. We then create a simple function swap to swap the contents of the array. We do this to simulate a data change. After that, we import the server.io library. We listen in on every connection and call the setInterval method every four seconds to swap the blog comments and emit the data to our clients (browsers).
To visualize this change we need to update our index.html and charts.js files.
Open your index.html file and add this code before the close of the body tag:
<!-- public/index.html --><scriptsrc="/socket.io/socket.io.js"></script><script>let socket =io('http://localhost');
      socket.on('connect',function(){});
      socket.on('event',function(data){});
      socket.on('disconnect',function(){});</script>
Open your charts.js file and update it to:
// public/js/charts.jslet socket;functioninit(){
     socket = io.connect("http://localhost:3000");
     socket.on('updateChart',(data)=>{functioncreateChart(){$("#chart").kendoChart({
                            dataSource:{
                                data: data
                            },
                            title:{
                                align:"left",
                                text:"Comments per day"},
                            legend:{
                                visible:false},
                            seriesDefaults:{
                                type:"column",
                                labels:{
                                    visible:true,
                                    background:"transparent"}},
                            series:[{
                                field:"value",
                                categoryField:"day",
                                colorField:"userColor"}],
                            valueAxis:{
                                max:28,
                                majorGridLines:{
                                    visible:false},
                                visible:false},
                            categoryAxis:{
                                majorGridLines:{
                                    visible:false},
                                line:{
                                    visible:false}}});}$(document).ready(createChart);$(document).bind("kendo:skinChange", createChart);});}$(init);
All we do in our chart.js file is swap out the datasource to data coming from the server.
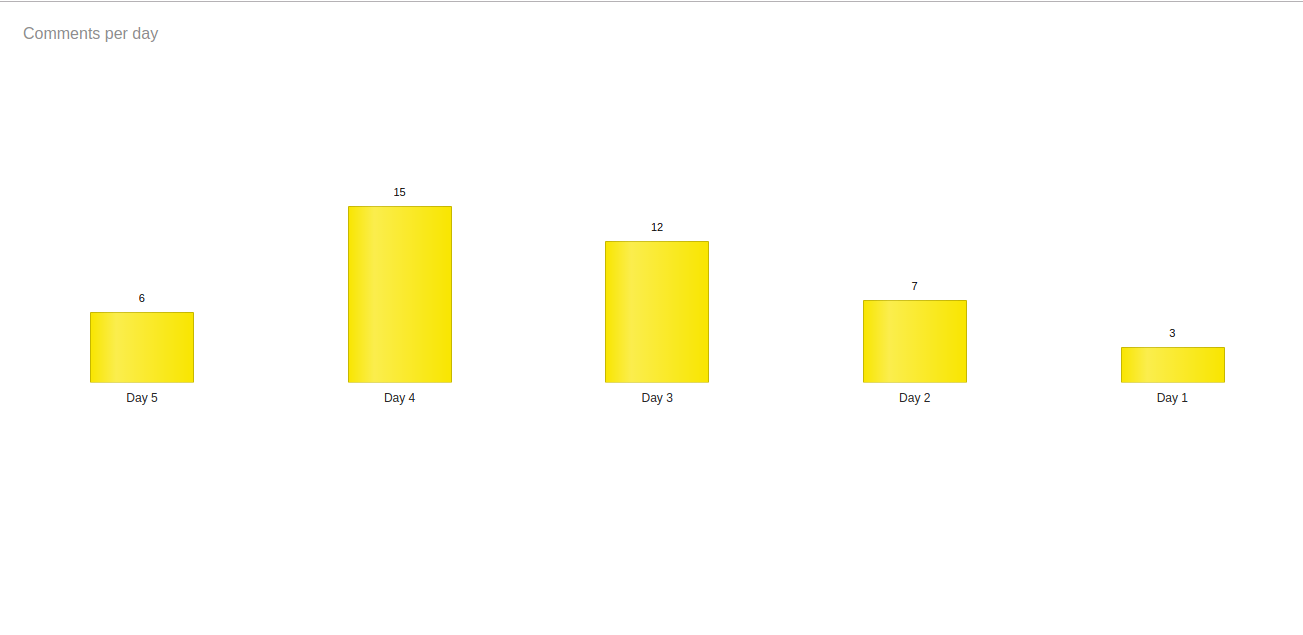
Now start your application by typing npm start under the project directory in your terminal. Open up http://localhost:3000 and you will see the chart update in real time.
N/B: All files used in this tutorial can be found here.
Conclusion
In this tutorial we learned how to use jQuery, Node.js, HTML and Kendo UI’s Chart Component to build a real-time chart application. This knowledge can help you create more complex real-time apps. Be sure to check out the Socket.io docs and post comments for clarity on parts you don’t understand. Happy coding.