Telerik Reporting enables developers to quickly report on data from their applications. Follow along to go through an example using Telerik Reporting with Kinvey's BaaS.
Using Telerik Reporting with Kinvey's BaaS provides an efficient data to reporting workflow. Let’s imagine, after using Progress Kinvey to quickly build and deploy your application, people are using it, they love it and then comes the need for some reporting about the application and its users. This is where Telerik Reporting shines.
In this post, we are going to use the sample application from Kinvey Studio to build a couple of reports using Kinvey’s BaaS. The Kinvey Studio sample is a vehicle fleet manager application. As the Senior Report Designer, our task is to create one report for Vehicle Inspections and another for Ticket Requests. Although before we start, there are a few house cleaning items.
Prerequisites
- Kinvey Account
- Create a free account at console.kinvey.com
- NOTE: Use the same credentials as the Telerik Account
- Kinvey Studio Installed
- Download the installer from studio.kinvey.com
- Install the downloaded .exe file
- Telerik Account
- Create a free account at www.telerik.com
- NOTE: Use the same credentials as the Kinvey Account
- Telerik Reporting Installed
- Download Telerik Reporting from www.telerik.com/account/product-download
- Install the downloaded .msi file
Getting Started with Kinvey's BaaS
After we have all the prerequisites set-up, we need some data and a backend before we can start building our reports. Kinvey Studio has a nice sample that takes just two clicks. To do this, open Kinvey Studio and create a Sample App. The following is a visual walk-through.
1. Start by opening Kinvey Studio from the Windows Start Menu
Image may be NSFW.
Clik here to view.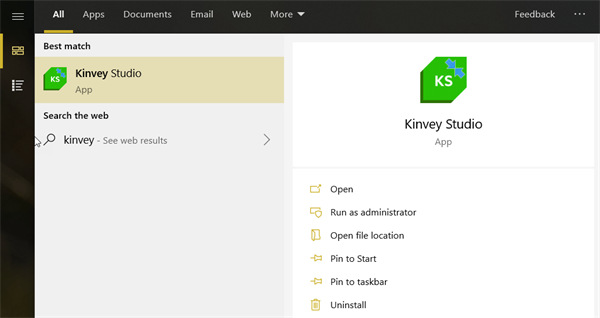
2. Log in and Create an App
Image may be NSFW.
Clik here to view.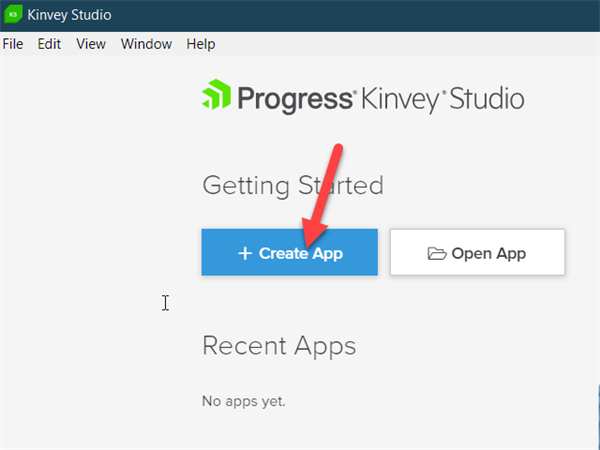
3. Name it, store and describe it
Image may be NSFW.
Clik here to view.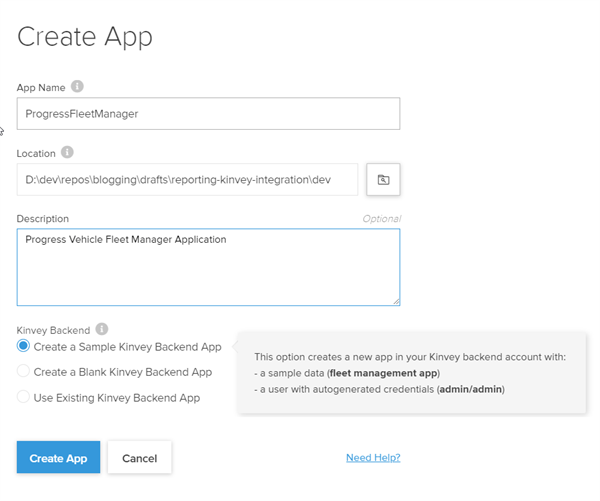
Voilà! That’s it. We have a RESTful API backend, some data, and a couple of users to work with.
Understanding the Data
An important aspect of using Telerik Reporting with Kinvey’s BaaS is understanding the data. Because of this, it deserves its own section. The key items are Collections, Querying the API and the Data Model. Let’s review them next.
Collections
The backend is a MongoDB (NO-SQL) database that contains collections of Entities. For the “non-mongo” aficionados, collections are sets of JSON documents and Entities are the basic unit of data in the form of key-value pairs.
Querying
Since Kinvey’s REST API is the interface to the MongoDB database this enables Mongo’s powerful query language. The general format of the RESTful API is as follows:
https://console.kinvey.com/appdata/[APP_KEY]/[COLLECTION_NAME]/?query=[FILTERS]&[MODIFIERS]
Additionally, using the Kinvey API Console we can test our queries.
Image may be NSFW.Clik here to view.
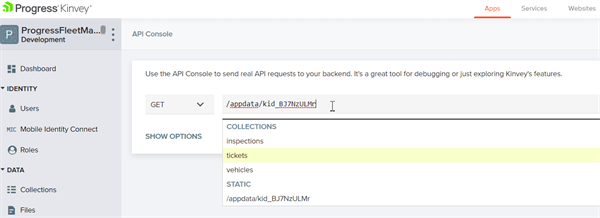 For more details on how querying works in Kinvey, see the Querying the Kinvey Data Source documentation.
Data Model
The model we are working with here is simple. There are collections of Inspections, Tickets, and Vehicles. Below is a screenshot of the Kinvey Console and another for the table representation.
The Kinvey Collections View
Image may be NSFW.
Clik here to view.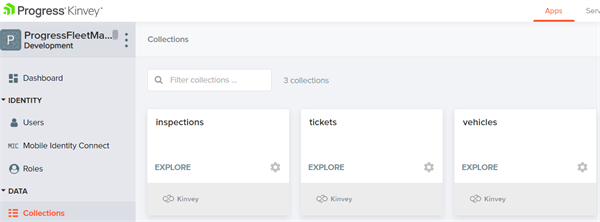
Image may be NSFW.
Clik here to view.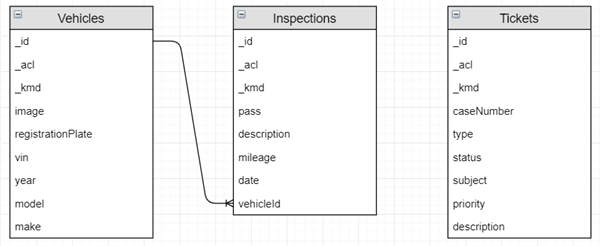
Bringing it All Together
Let’s look at what some actual queries against our Kinvey Back-end would look like.
A query used to get all the vehicles would be:
https://console.kinvey.com/appdata/[APP_KEY]/vehicles/
A query used to get a single entity would look like below:
https://console.kinvey.com/appdata/[APP_KEY]/vehicles?query={"[KEY]":"[VALUE]"}The following is the query for getting a single vehicle:
https://console.kinvey.com/appdata/[APP_KEY]/vehicles?query={"vehicleId":"[VEHCILE_ID]"}
All right, we have a basic understanding of what our backend is, what it looks like and how to get data. Let's build some reports.
Building Reports in Telerik Reporting
We’ll focus on two simple reports. The first is a Vehicle Inspections Report and the second is a Ticket Requests Report. I’ll go over each in more detail as we build them. But first, let’s review connecting the API.
Connecting the Data
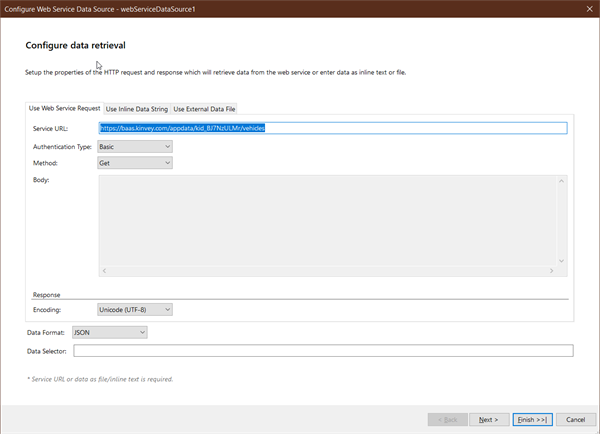
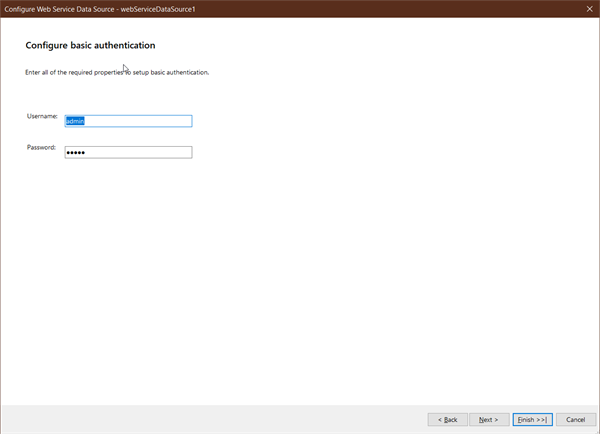
We’ll use the Web Service Data Source in Telerik Reporting. The data source uses two types of authentication, Basic and 2-Step (Bearer). For simplicity, we are using the Basic configuration. This is a username and password combination which has been provided for us in the sample. Let’s review setting this up.
1. Open the Stand-Alone Designer
2. Select the Data Tab
3. Choose the WebServiceDataSource
4. Configure the Data Source as Follows
NOTE: This demo backend will be deleted by the time this goes live.
1. Enter the URL Query String Image may be NSFW.Clik here to view.
2. Enter the Username and Password
NOTE: The demo username and password combination is UN: admin and PWD: admin
Image may be NSFW.
Clik here to view.
3. Preview the data
Image may be NSFW.
Clik here to view.
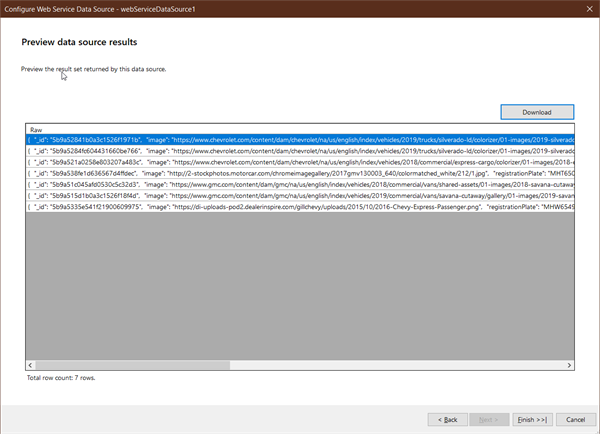
That's all we need to configure the Web Service Data Source. Let's build some reports.
Creating the Vehicle Inspections Report
With this report, we are going to display the inspections that have been completed for each vehicle. This will require a filter on the data at the table level. Additionally, we’ll need a dropdown to select the Vehicle number and view the inspections.
- Create the Vehicles Data Source
- URL: https://baas.kinvey.com/appdata/[APP_KEY]/vehicles
- Create the Inspections Data Source
- URL: https://baas.kinvey.com/appdata/[APP_KEY]/inspections
- Create the Vehicle Id Report Parameter
- Use the Vehicles Data Source
- Properties:
- Display Member: = “VIN: “ + Fields.vin
- Value Member: = Fields._id
- AutoRefresh: true
- Visible: true
- Value: = First(Fields._id)
- Create Table to display Inspections
- Use the Inspections Data Source
- Filter the Table based on the report parameter
- Filters: = Fields.vehicleId = = Parameters.vehicleId.Value
- Sort the data in ascending order
- Sortings: = Fields.data Asc
- Set the No Data Message
- NoDataMessage: = “No Inspections”
- Drag desired fields to respective columns
Image may be NSFW.
Clik here to view.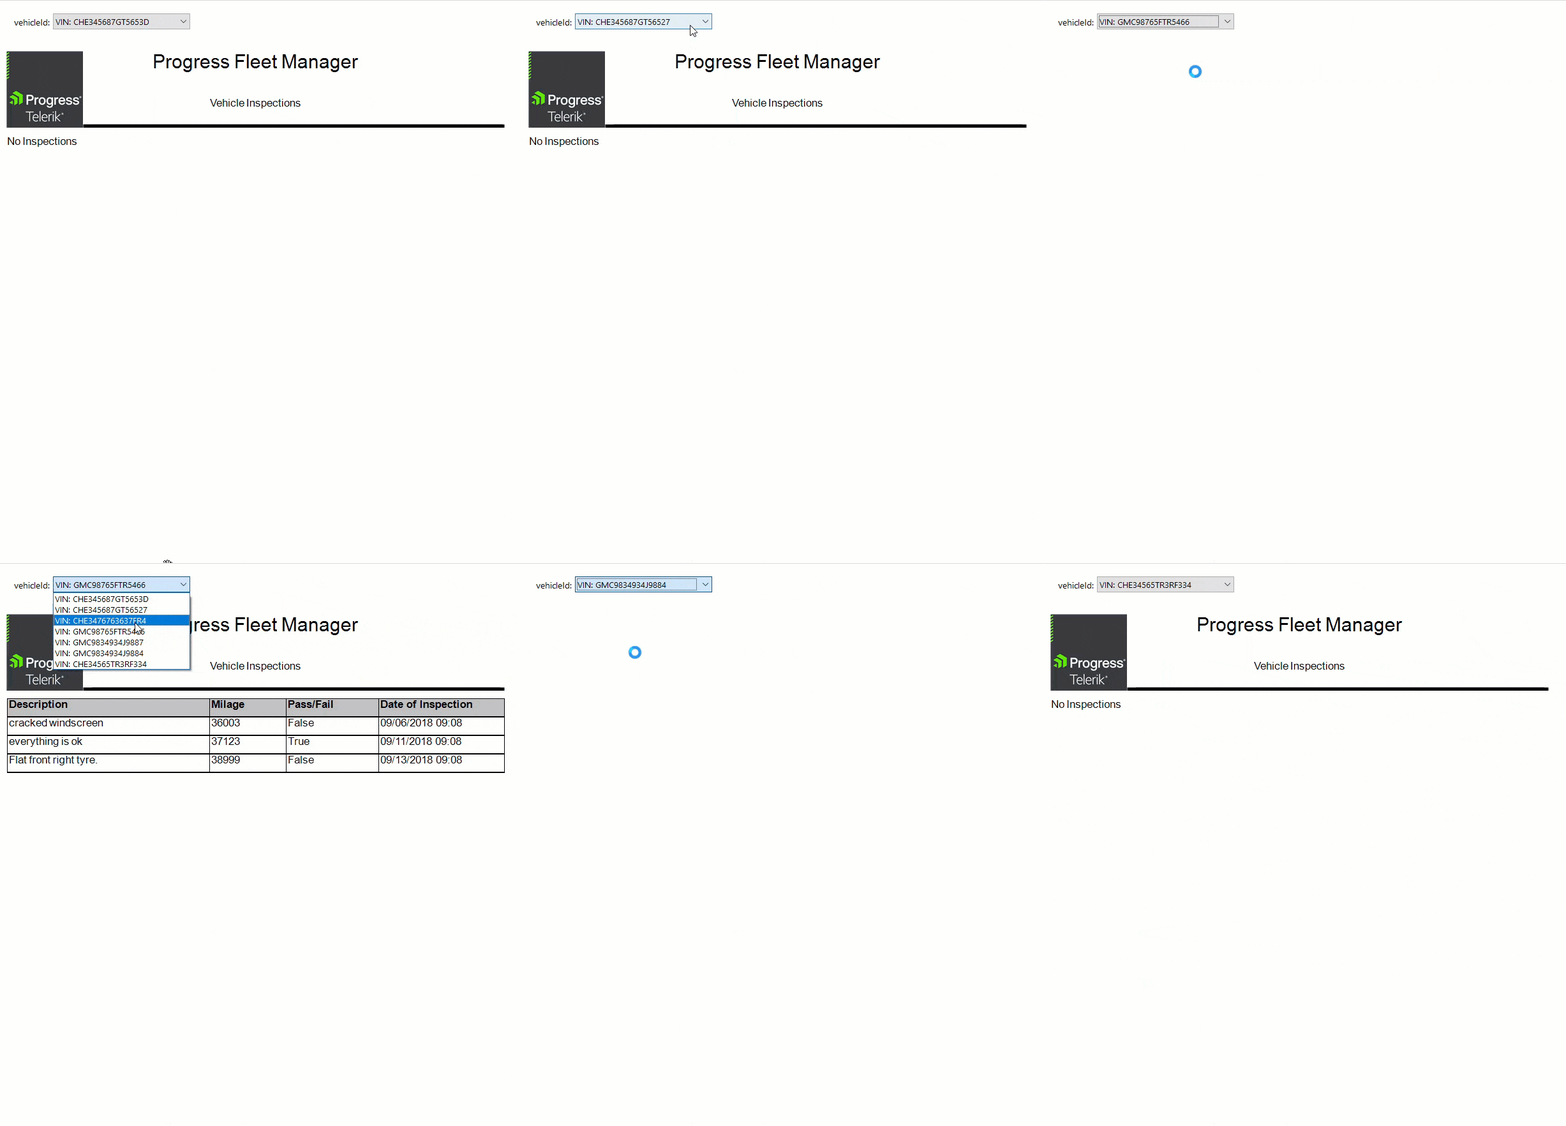
Creating the Maintenance Ticket Requests Report
With this report, we are going to display Ticket Details by type of Ticket. The filter will apply at the data source level and will filter by a property value and not a unique identifier. In most cases, this would provide a list of duplicate items. However, a nice feature is Reporting automatically configured the query to select distinctly. This is nice for non-indexed properties.
- Create the Type Data Source
- URL: https://baas.kinvey.com/appdata/[APP_KEY]/tickets
- Create Query Parameters with the below name and values
- Parameter 1: Name=query; Value={}
- Parameter 2: Name=fields; Value=type
- Create the Tickets data source
- URL: https://baas.kinvey.com/appdata/[APP_KEY]/tickets
- Create the Report Parameter
- Use the Type Data Source
- Properties:
- Display member: = Fields.type
- Value member: = Fields.type
- AutoRefresh: true
- Visible: true
- Value: =First(Fields.type)
- Create Table to display tickets
- Use tickets data source
- Filter Table data based on the report parameter
- Filters: = Fields.type = = Parameters.Types.Value
- Drag desired fields to respective columns
Image may be NSFW.
Clik here to view.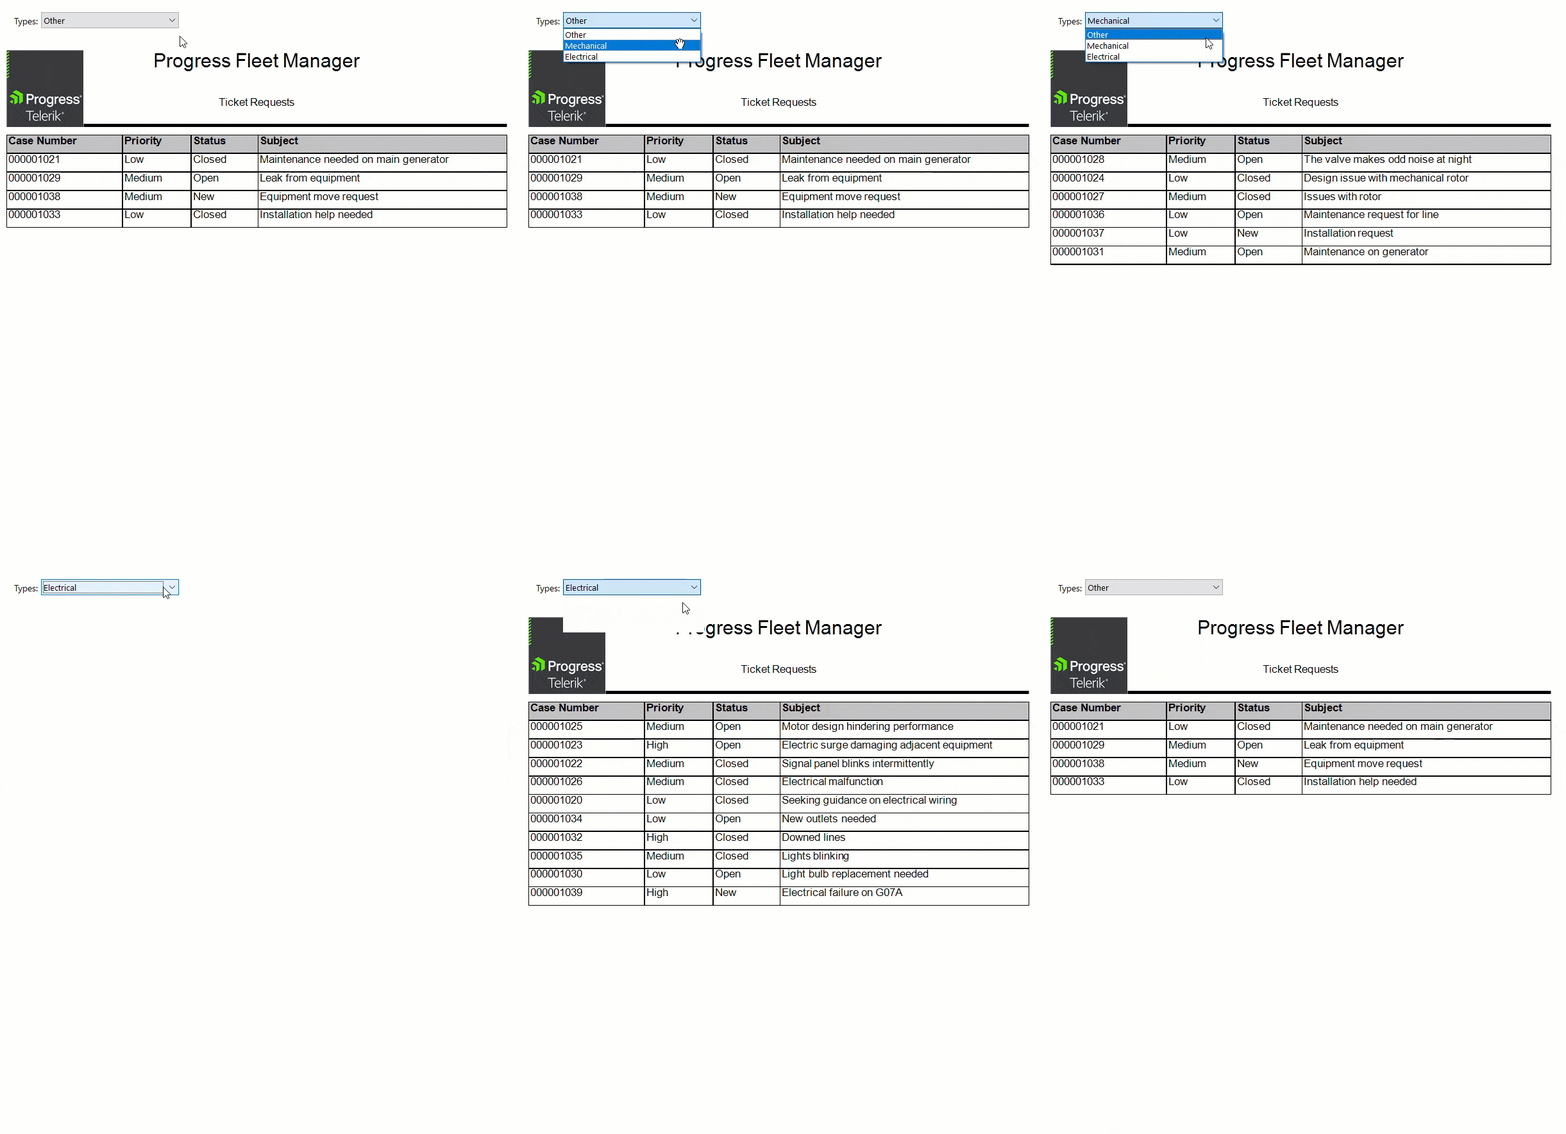
What's Next
As seen in this post, Telerik Reporting is a powerful tool for designing reports from many different data source types. But reports are not useful unless they communicate information. This leads to another important feature of reporting; the delivery. Telerik Reporting can deliver reports in many different form factors with a Build Once, Deliver Everywhere approach. Let’s look at how this might work.
Reporting can host reports in various applications using Report Viewers. These include mobile-friendly Web, Windows Forms and WPF applications. With the use of Report Viewers, reports can be easily shared in different formats like PDF, XLSX, and Word. Additionally, these formats can be delivered via export or email. The best part is that all this functionality is available to the user directly from the Report Viewer with minimal code and configuration.
For Enterprise scenarios, our Report Server allows for collaborative delivery. Viewing reports is the same through a Report Viewer except designers work on a report that is a single source of truth and the report is delivered as it is updated. Additionally, the Report Server includes a RESTful API that can be used to build custom application integrations.
Conclusion
In closing, integrating Telerik Reporting with Kinvey’s BaaS enables an efficient data to report workflow. Nowadays, web data is moving rapidly and with the use of NO-SQL databases, the shape of the data is ever-changing as well. Telerik Reporting and the Web Service Data Source provides seamless integration with a RESTful API that can be used to build and deliver reports at a speed compatible with web data.