Measuring the performance of JavaScript web applications is an important way to give your users the speed they expect. We'll discuss a few Chrome DevTools that can help us measure the performance of our applications.
JavaScript powers lots of websites and web applications on the web today. These websites and applications are expected to be blazing fast if we plan to retain our users. Accurately measuring the performance of web applications is an important aspect of making web applications faster.
In this article, we’ll cover a few tools that can help us measure the performance of our applications. They include:
- Chrome DevTools Performance panel
- Lighthouse
Prerequisites
A basic familiarity of Chrome DevTools will help you get the best out of this tutorial.
Performance Panel
Chrome’s Performance panel provides us with tools to help us analyze the runtime performance of our applications. The runtime performance of an application is how the app performs when it is running.
When analyzing the performance of any application, it is best done in the browser’s Incognito Mode. This ensures that performance measurement is not affected by other factors such as installed extensions.
To access the Performance panel, first press Command+Option+I on Mac or Control+Shift+I on Windows and Linux, to open DevTools. Once in DevTools, click the Performance tab:
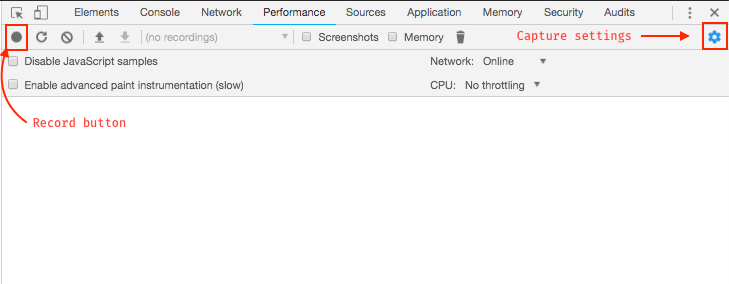
The Performance panel contains a few items:
- A record button to capture performance metrics
- A reload button to record and evaluate the page load
- A screenshot checkbox for capturing screenshots during performance profiling
- A memory checkbox for capturing memory issues that affect performance
- A capture settings icon that reveals more settings related to how performance metrics should be captured
Recording Runtime Performance
To record the runtime performance of a page on your app, while on that page, open the Performance panel, select the options you want, click the record button, and start using the page as you normally would. DevTools captures performance metrics as the page runs:

When you’re done interacting with the page, click the stop button. The performance profiling stops and the results are displayed on the Performance panel:
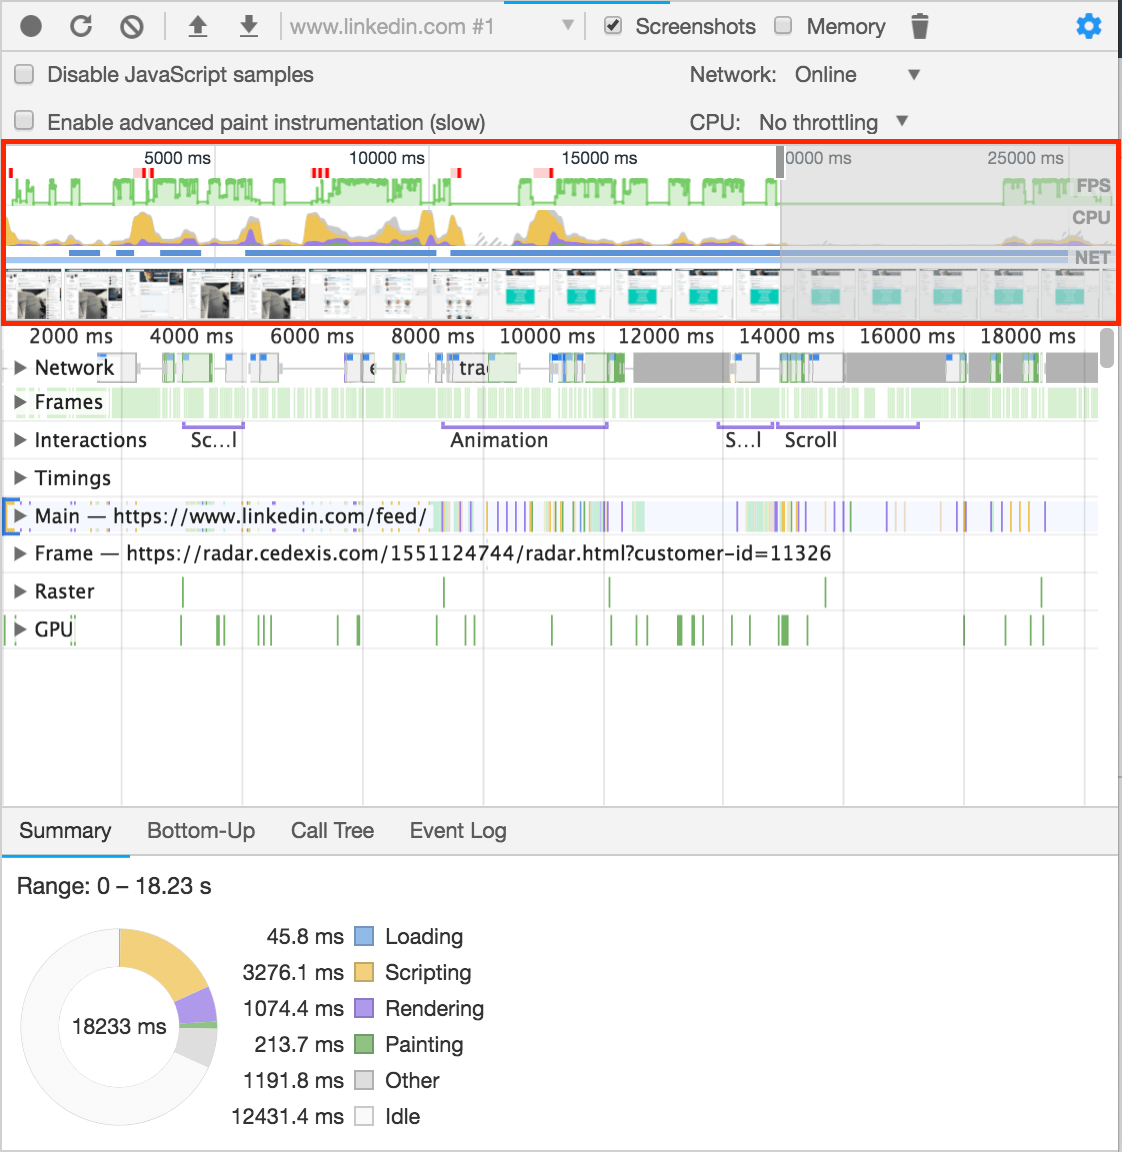
Analyze Profiling Result
The performance result returned contains data on Network, Frames, Interactions, Main Thread, and a few others. Each data is in a section, and expanding a section shows you the associated data. At the top of the result (outlined in red above) is the Overview section which contains both screenshots and information from other sections. At bottom of the result is a Summary tab that contains a breakdown of all activities.
The Frames section contains data for one of the most important metric for measuring performance for animations in your app. The recommended rate is 60 FPS (frames per second) and anything above that leads to poor performance. Hovering over the green bars in the Frames section shows you the frame rate of that particular frame, and any frame above 60 FPS means there’s performance optimization to be done:

The Main section contains data on the activity on the main thread. This data is presented in form of a flame chart. The x-axis represents the recording over time, while the y-axis represents the call stack. Each bar in the chart represents an event, and the wider a bar, the longer the event took. When events are stacked on each other, it means the upper event triggered the ones below it.
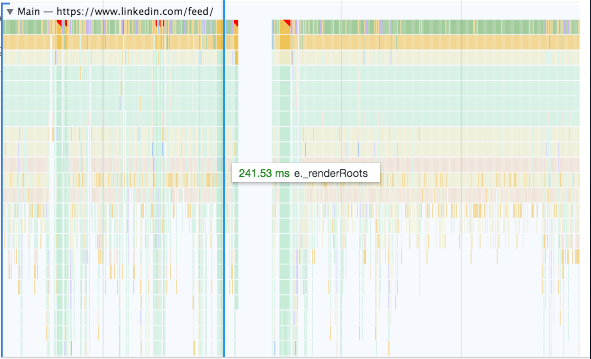
The flame chart in the main section mostly contains a lot of data. You can zoom in on individual events by clicking, holding and dragging your mouse over the overview section:
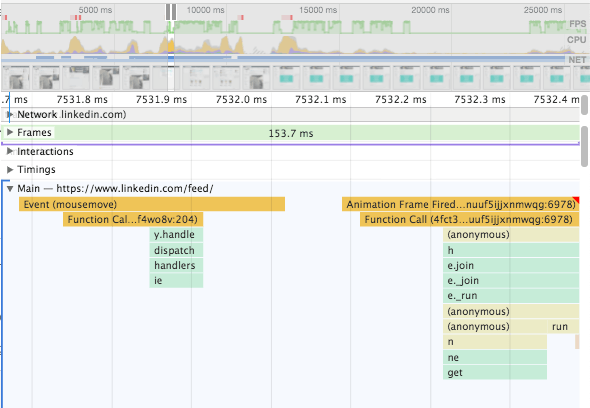
In the zoomed-in view, we can see a mousemove and an Animation Frame Fired event with a red triangle. The red triangle an event is a warning that indicates there’s a performance issue related to that event.
On clicking the event, the summary tab shows you more information about the event:
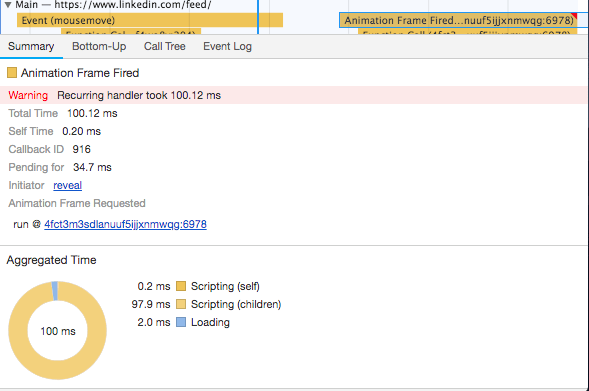
In the image above, we can see that the event took 100.12 ms. The aggregated chart shows us that 97.9 ms of the total time spent was by children events. Clicking the reveal link highlights the event that initiated the Animation Frame Fired event, while clicking the link after the run @ text takes you to the relevant line in the source code. This way, you know what line needs modification.
Lighthouse
Lighthouse is an open-source tool by Google for improving the quality of web pages. It performs a series of audits against a page and generates a report on the page’s performance with suggestions on how to improve the page.
Lighthouse powers the Audits tab in Chrome, thereby making it easy to get a report of your page’s performance. Lighthouse also has a Chrome extension. To access Lighthouse, open DevTools and click the Audits tab:
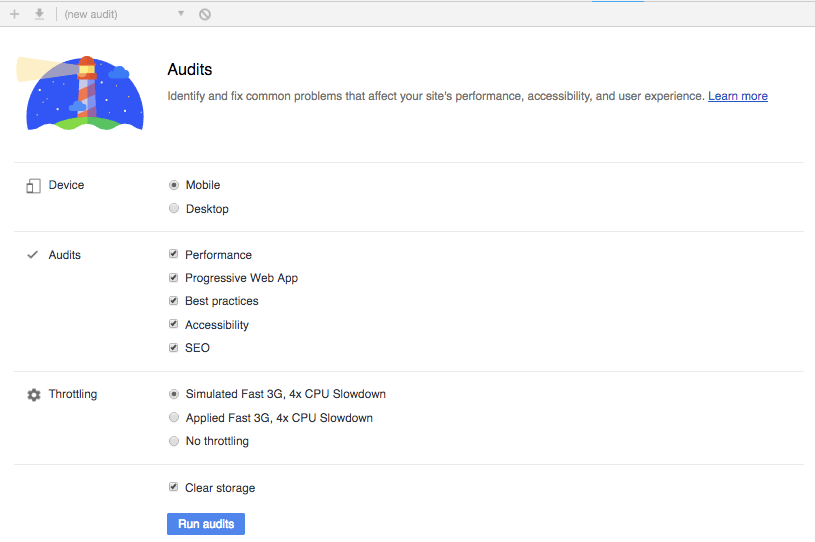
The Audits tab contains device options for Lighthouse to measure performance in both mobile and desktop devices. There are performance options to select from and also options for throttling network/CPU.
To perform a Lighthouse audit on your page, while on that page, select your preferred options and click the Run audits button. This kickstarts a performance audit based on your selected options:
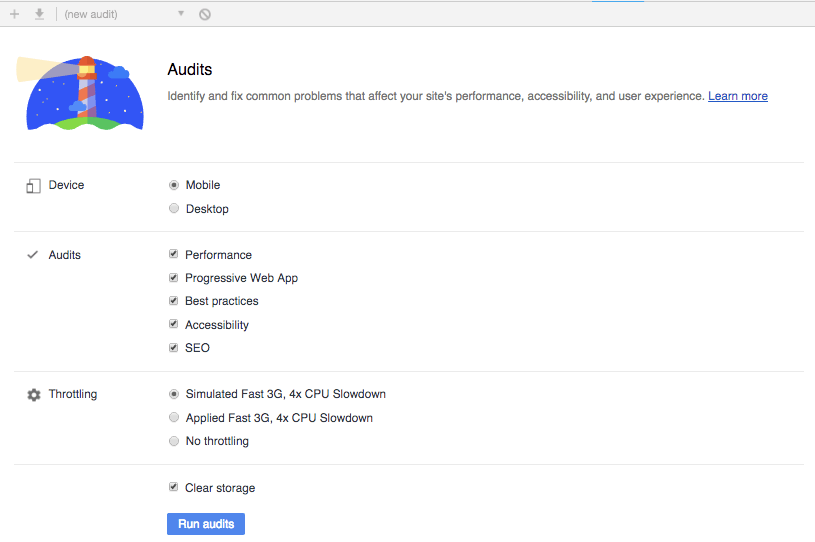
The performance audit runs for about one to two minutes and returns a report on how the page performed:
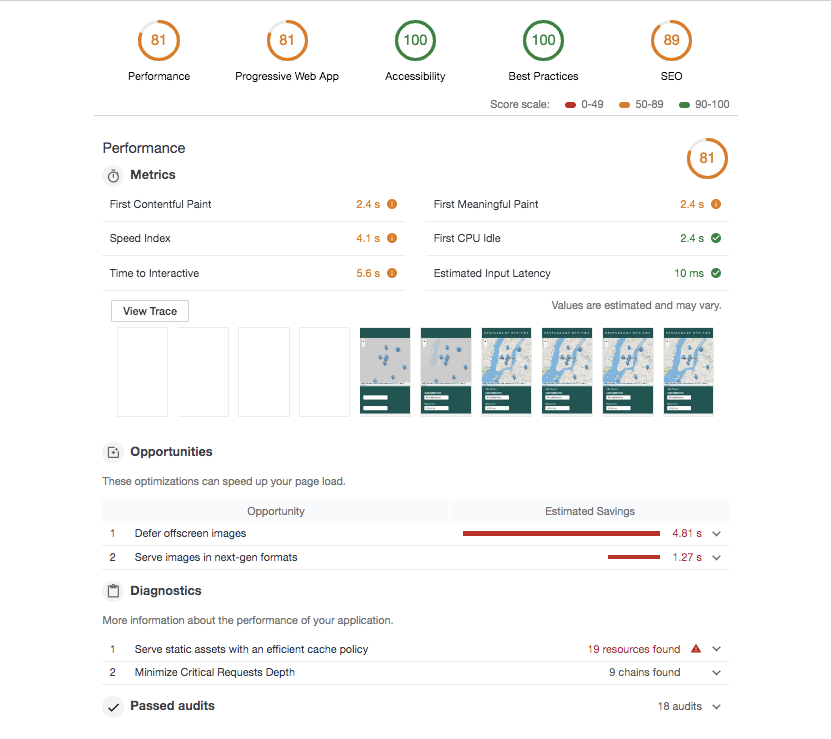
The report contains an overview of how the page performed based on the selected performance criteria. Each criterion then has a detailed section of performance issues with specific solutions to fix them.
Conclusion
In this article, we’ve gone over the developer tools Chrome offers us to improve the performance of a JavaScript application. I hope you’ve learned a lot to help you build more performant JavaScript applications.
This blog has been brought to you by Kendo UI
Want to learn more about creating great web apps? It all starts out with Kendo UI - the complete UI component library that allows you to quickly build high-quality, responsive apps. It includes everything you need, from grids and charts to dropdowns and gauges.


